 Global| Feb 01 2019
U.S. Employment Strengthens in January but Wage Growth Slips; Unemployment Rate Edges Higher
by:Tom Moeller
|in:Economy in Brief
Summary
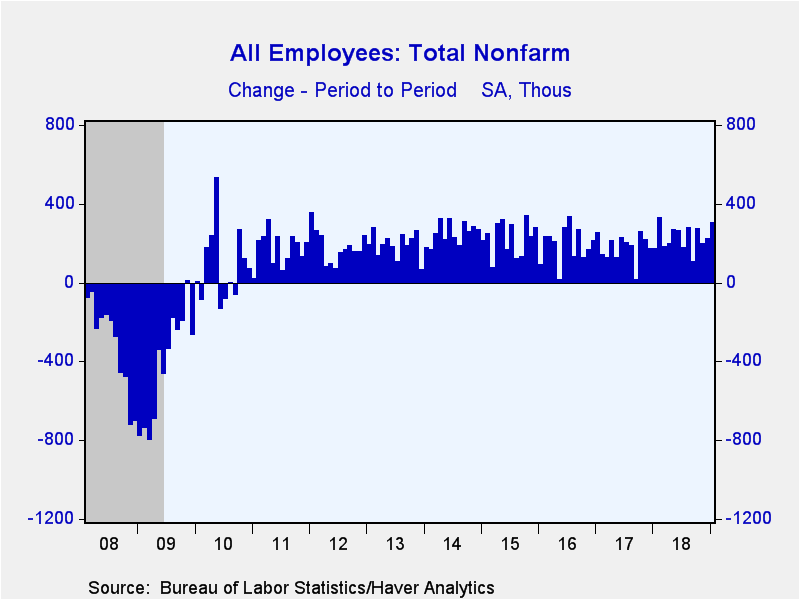
The job market remains firm. Nonfarm payrolls increased 304,000 (1.9% y/y) during January, but December's gain was revised downward to 222,000 from 312,000 reported last month. November's increase was revised up slightly to 196,000 [...]
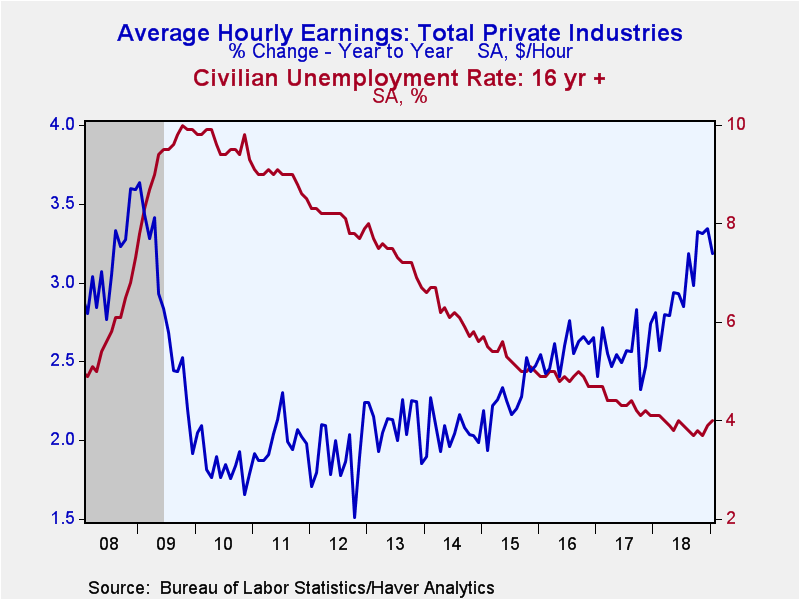
The job market remains firm. Nonfarm payrolls increased 304,000 (1.9% y/y) during January, but December's gain was revised downward to 222,000 from 312,000 reported last month. November's increase was revised up slightly to 196,000 from 176,000. The January increase exceeded expectations for a 165,000 rise in the Action Economics Forecast Survey. Data back through January 2014 were revised. Average hourly earnings ticked 0.1% higher and fell short of expectations for a 0.3% rise. The gain followed an unrevised 0.4% December jump. The y/y increase eased to a 3.2%, but still was nearly the strongest 12-month gain since April 2009. The unemployment rate increased to 4.0%, the highest level since June, up from November's low of 3.7%. Stability at 3.9% had been expected.
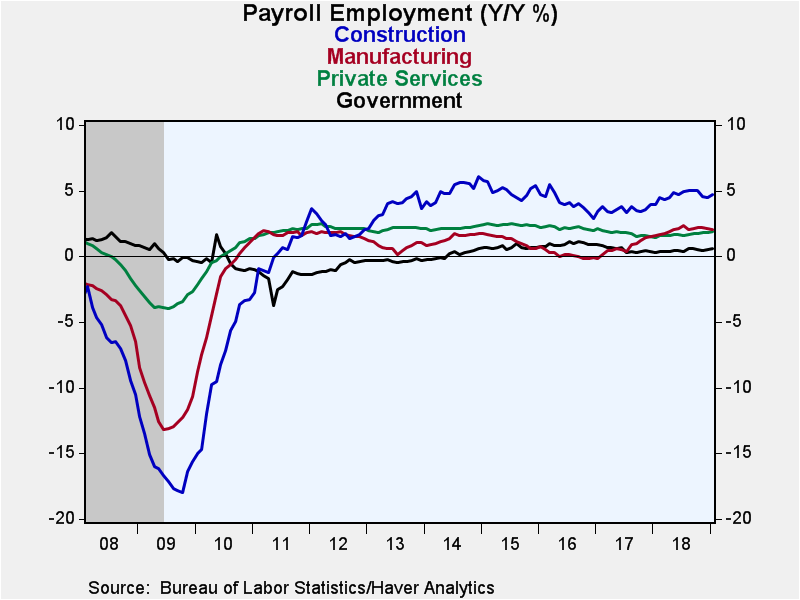
Strength in payroll employment was evident in a 52,000 worker increase (5.1% y/y) in construction employment. It was the largest increase in 11 months. Standing in contrast to this strength was a weaker 13,000 increase (2.1% y/y) in factory sector payrolls. It was the smallest increase in five months. Mining & logging payrolls increased 7,000 (8.7% y/y), the strongest gain also since August.
Private service sector payrolls increased a sharp 224,000 (1.9% y/y), but December's gain was revised down to 153,000 from 227,000 reported last month. Leisure & hospitality employment increased a strengthened 74,000 (2.6% y/y) after a 55,000 increase. Education & health services employment rose 55,000 (2.2% y/y) following a 67,000 jump, which was downwardly revised. Employment in trade, transportation & utilities gained 52,000 (1.2% y/y) after a slight decline in December, revised from a 34,000 gain. Professional & business services employment rose a lessened 30,000 (2.6% y/y), roughly half the monthly increases logged last spring. The number of temporary help jobs inched 1,000 higher (2.8% y/y) following double digit-gains from August trough October. Financial activities employment rose a strengthened 13,000 (1.5% y/y), but the number of information jobs declined 4,000 (+0.3% y/y), down for the fifth month in the last six.
Government sector employment increased 8,000 (0.6% y/y), half the prior month's increase. Local government employment rose 9,000 (0.6% y/y) following a 13,000 rise. Federal government jobs inched 1,000 higher (0.1% y/y) after falling in December. State government employment declined 2,000 (+0.7% y/y), the third decline in the last four months.
The 0.1% increase (3.2% y/y) in average hourly earnings was reduced by declines in goods-producing industries. Construction sector earnings plunged 0.7% (+2.8% y/y), by far the largest decline in five years. Factory sector earnings fell 0.4% (+1.4% y/y) after two months of 0.3% increase. Mining sector wages eased 0.2% (+1.2% y/y), off for the second straight month. Offsetting these declines was a fourth consecutive 0.4% rise (3.5% y/y) in private service sector earnings. The rise was paced by a 1.4% jump (7.3% y/y) in information service sector earnings which added to two straight 0.8% increases. Education & health service sector earnings strengthened 0.4% (2.8% y/y), doubling the prior two months' increases. Financial sector earnings rose a steady 0.3% (3.7% y/y) but financial & business service sector earnings inched just 0.1% higher (2.8% y/y) for the third straight month.
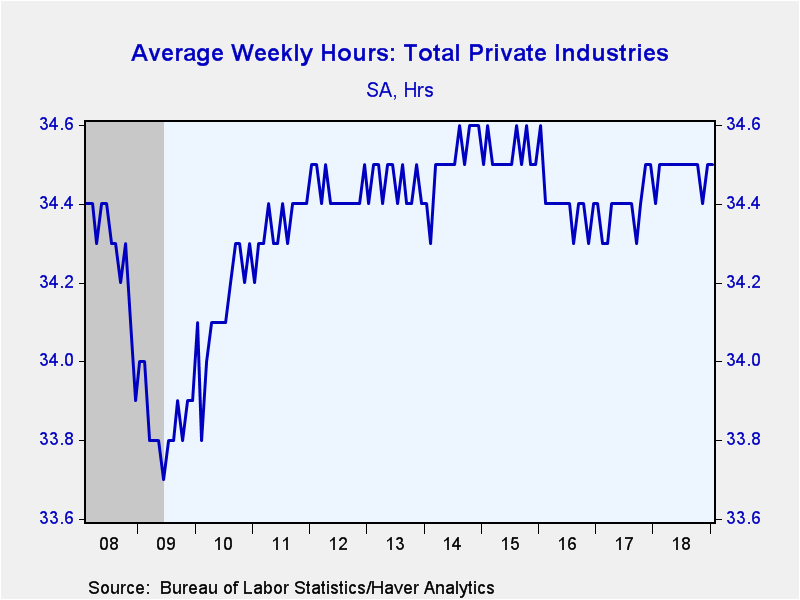
The length of the average workweek held steady at 34.5 hours. Mining & logging sector hours eased m/m to 46.1, but have risen sharply during the last three years. Manufacturing sector hours also eased to 40.8, having been fairly steady for three years. The length of the construction sector workweek surged to a record 39.9 hours. Financial activities hours rose slightly to 37.7. Information service sector hours plunged to 35.9 while private service-sector hours held steady at 33.3, where they've been for six months. The trade, transportation & utilities workweek plunged to 34.2 hours, the shortest in nearly two years, but the education & health services workweek held steady at 33.0 hours. Leisure & hospitality hours edged up to 26.1.
As is usually the case in January, the information from the household employment survey is a little more difficult to interpret. Each January, the Labor Department incorporates updates population estimates from the Census Bureau, which reflect new information and assumptions about the growth of the population. However, the BLS does not revise the official household survey estimates for the previous December and earlier months. Therefore, the December 2018 household survey figures are incomparable with the January 2019 figures. The BLS does, however, publish the size of these adjustments to the labor force, employment and unemployment so that meaningful comparisons can be made between December and January. Note that since the population adjustments impact numerator and denominator of the ratios calculated from the household survey data (that is, the unemployment rate and the labor force participation rate), the calculation of these values is not meaningfully impacted by the population adjustment.
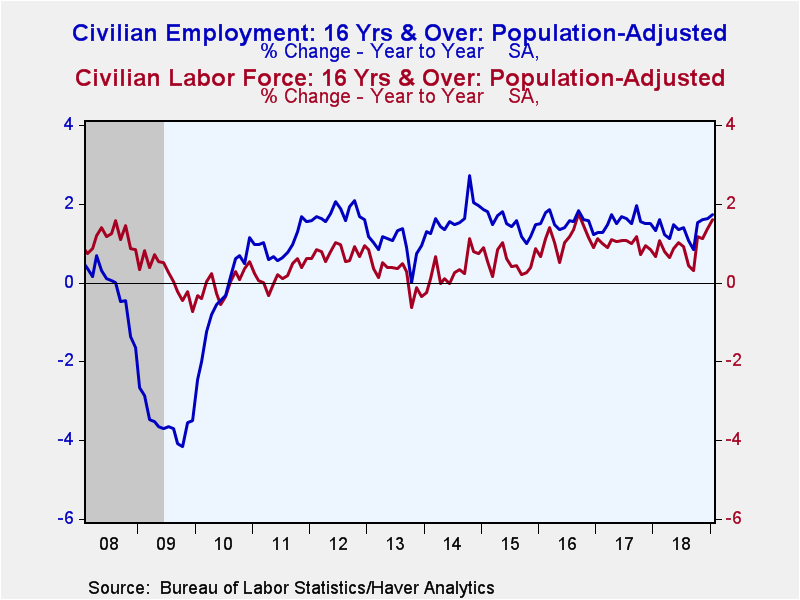
The population-adjusted household survey was generally strong in January even though the unemployment rate edged up to 4.0% from 3.9% in December. Expectations were for an unchanged reading of 3.9%. To demonstrate how the population adjustment impacts the monthly comparison of the household survey data, the raw data showed the labor force declining 11,000 in January from December. However, the population adjustment was -506,000, meaning that the population-adjusted labor force rose 495,000 in January from December, pushing the labor force participation rate up 0.1%-point to 63.2% (its highest level in five years). In other words, the vibrant labor market continues to attract people into the labor force. Raw employment fell 251,000 in January from December, but rose 237,000 after the population adjustment. And the 241,000 increase in raw unemployment was bumped up to 259,000 after the population adjustment.
The federal government shutdown also impacted the household survey in January, in contrast to its lack of impact on the establishment survey. The more than 300,000 federal government employees that were not working during the survey period should have been classified as unemployed on temporary layoff. And indeed, this number did increase in January. However, the BLS noted that there was also an increase in the number of federal workers who were classified as employed but absent from work. The BLS thought that most of these should have been classified as unemployed on temporary layoff, but recorded the survey results as they were received. At the bottom line, while the number unemployed in January was elevated by the federal government shutdown, this elevation was probably understated (but only temporarily as the federal government has already reopened).
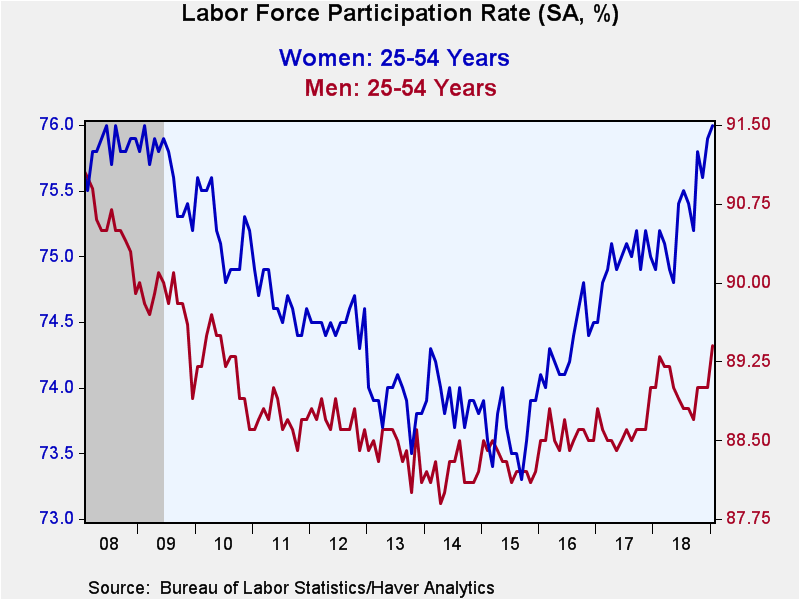
Digging more deeply into the household survey, the labor force participation rate for those aged 25-54 (the key working age group) jumped up 0.3%-point to 82.6%, its highest reading in nearly eight years. For men of that age, it increased 0.4%-point to 89.4% and for women it edged up 0.1%-point to 76.0%. The unemployment rate, including those who are marginally attached and working part-time for economic reasons, jumped up to 8.1% in January from 7.6%. The average duration of unemployment fell to 20.5 weeks from 21.8 weeks.
The unemployment rate for those with less than a high school diploma edged down to 5.7%. For high school graduates but no college, it was unchanged at 3.8%. For those with some college, the unemployment rate edged up to 3.4%. And for individuals with a college degree, the unemployment rate increased to 2.4% from 2.1%.
By age group, the unemployment rate for individuals aged 16-24 rose to 9.1% in January from 8.7% in December, and for those aged 20-24, the jobless rate increased to 7.6% from 7.2%. The unemployment rate for individuals aged 25-54 years old edged up to 3.3% from 3.2%, and for those over age 55 and over, the rate increased to 3.2% from 2.9%.
The labor market data are contained in Haver's USECON database. Detailed figures are in the EMPL and LABOR databases. The expectations figures are in the AS1REPNA database.
| Employment: (SA, M/M Change, 000s) | Jan | Dec | Nov | Jan Y/Y | 2018 | 2017 | 2016 |
|---|---|---|---|---|---|---|---|
| Payroll Employment | 304 | 222 | 196 | 1.9% | 1.7% | 1.6% | 1.8% |
| Previous Estimate | -- | 312 | 176 | -- | -- | -- | |
| Manufacturing | 13 | 20 | 27 | 2.1 | 2.0 | 0.7 | 0.1 |
| Construction | 52 | 28 | 5 | 5.1 | 4.6 | 3.6 | 4.1 |
| Private Service-Producing | 224 | 153 | 171 | 1.9 | 1.7 | 1.8 | 2.2 |
| Government | 8 | 16 | -4 | 0.6 | 0.5 | 0.6 | 0.9 |
| Average Weekly Hours - Private Sector | 34.5 | 34.5 | 34.4 | 34.4 | 34.5 | 34.4 | 34.4 |
| Private Sector Average Hourly Earnings (%) | 0.1 | 0.4 | 0.3 | 3.2 | 3.0 | 2.6 | 2.6 |
| Unemployment Rate (%) | 4.0 | 3.9 | 3.7 | 4.1 | 3.9 | 4.4 | 4.9 |
Tom Moeller
AuthorMore in Author Profile »Prior to joining Haver Analytics in 2000, Mr. Moeller worked as the Economist at Chancellor Capital Management from 1985 to 1999. There, he developed comprehensive economic forecasts and interpreted economic data for equity and fixed income portfolio managers. Also at Chancellor, Mr. Moeller worked as an equity analyst and was responsible for researching and rating companies in the economically sensitive automobile and housing industries for investment in Chancellor’s equity portfolio. Prior to joining Chancellor, Mr. Moeller was an Economist at Citibank from 1979 to 1984. He also analyzed pricing behavior in the metals industry for the Council on Wage and Price Stability in Washington, D.C. In 1999, Mr. Moeller received the award for most accurate forecast from the Forecasters' Club of New York. From 1990 to 1992 he was President of the New York Association for Business Economists. Mr. Moeller earned an M.B.A. in Finance from Fordham University, where he graduated in 1987. He holds a Bachelor of Arts in Economics from George Washington University.
More Economy in Brief
 Global| Feb 05 2026
Charts of the Week: Balanced Policy, Resilient Data and AI Narratives
by:Andrew Cates


