 Global| Aug 15 2008
U.S. Empire State Index Slightly Positive
by:Tom Moeller
|in:Economy in Brief
Summary
The Federal Reserve Bank of New York reported that its July index of manufacturing activity in the Empire State improved to a slightly positive 2.77 after having been at -4.92 during June. It was the first positive reading since April [...]
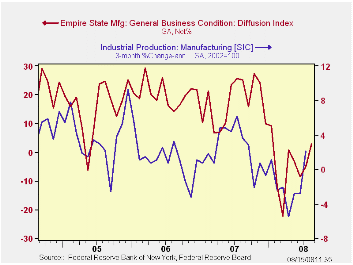
The Federal Reserve Bank of New York reported that its July index of manufacturing activity in the Empire State improved to a slightly positive 2.77 after having been at -4.92 during June. It was the first positive reading since April though the level of the index remained quite low. A reading of -4.2 for July had been the Consensus expectation.
The figure is a diffusion index. Since the series' inception in 2001 there has been a 55% correlation between the index level and the three-month change in U.S. factory sector industrial production.
The subseries for new orders, shipments and the number of employees all remained negative last month while the series for inventories and the average employee workweek turned positive.
The employment index was near the most negative reading since 2003. In the (perhaps too) short seven year history of the NY employment index, there has been an 86% correlation between it and the three-month growth in overall factory sector employment.
Like the Philadelphia Fed Index of General Business Conditions, the Empire State Business Conditions Index reflects answers to an independent survey question; it is not a weighted combination of the components.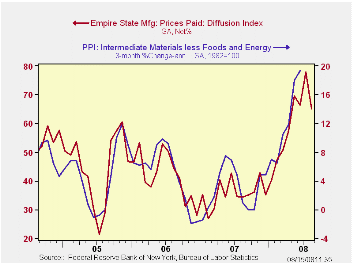
Pricing pressure eased to its lowest level since April after hitting a series' high in June. Since inception in 2001 there has been an 81% correlation between the index of prices paid and the three-month change in the core intermediate materials PPI.
The Empire State index of expected business conditions in six months improved to its highest level this year after having fallen sharply in June. The subseries for new orders and shipments were up sharply while the employment series showed just a modest gain.
The Empire State Manufacturing Survey is a monthly survey of manufacturers in New York State conducted by the Federal Reserve Bank of New York. Participants from across the state in a variety of industries respond to a questionnaire and report the change in a variety of indicators from the previous month. Respondents also state the likely direction of these same indicators six months ahead.For more on the Empire State Manufacturing Survey, including methodologies and the latest report, click here.
The Changing Nature of the U.S. Balance of Payments from the Federal Reserve Bank of New York is available here.
| Empire State Manufacturing Survey | July | June | July '07 | 2007 | 2006 | 2005 |
|---|---|---|---|---|---|---|
| General Business Conditions (diffusion index, %) | 2.77 | -4.92 | 25.18 | 17.23 | 20.24 | 15.53 |
| Prices Paid | 65.17 | 77.89 | 34.41 | 35.64 | 41.88 | 44.74 |
by Tom Moeller August 15, 2008
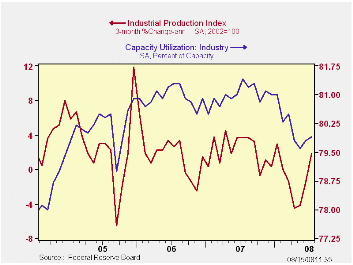
For July, industrial production rose 0.2% after an unrevised 0.5% gain during June. Consensus expectations had been for no change in output last month.
Utility output reversed its June increase and fell by 1.8% as the summer heat moderated.
Factory output increased 0.4% which was its best monthly increase since last September. In addition, the three-month rate change improved to 2.2% (AR) which was its best since since last September. Output of motor vehicles & parts was strong during the last two months and rose 3.6% (-10.4% y/y) after a 4.8% June increase. The strike was settled at American Axel company.
The trend in output outside the high-tech sector has been decidedly weak due to that strike. Less high-tech, factory output did repeat its June rise of 0.2% and three-month output growth rose to 1.9% (AR). But the industry detail continued mixed. July output of furniture fell 0.9% and at a 7.0% rate during the last three months. Apparel output dropped 0.5% last month. To the upside was output of electrical equipment rose at a 4.2% rate during the last three months. Machinery output recovered some of its earlier weakness with a 2.5% rise during the last three months.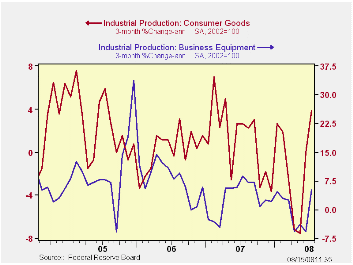
Production in the high tech sector rose 0.3% (17.4% y/y) during July but that y/y growth was down from the peak in March of 27.6%. Production of computers & office equipment rose 0.7% (15.4% y/y) but the three-month growth rate is slower at 6.9% (AR). Output of communications equipment fell 0.2% last month and three-month growth was a negative 1.4%.
Capacity utilization ticked up to 79.9%. Utilization in the factory sector rose to 77.8%, near its lowest also since late-2004.
Will Farmland Values Keep Booming? from the Federal Reserve Bank of Kansas City can be found here.
| INDUSTRIAL PRODUCTION (SA, %) | July | June | Y/Y | 2007 | 2006 | 2005 |
|---|---|---|---|---|---|---|
| Total Output | 0.2 | 0.5 | -0.2 | 1.7 | 2.2 | 3.3 |
| Manufacturing | 0.4 | 0.1 | -1.1 | 1.7 | 2.4 | 4.0 |
| Consumer Goods | 0.3 | 0.9 | -1.1 | 1.7 | 0.3 | 2.8 |
| Business Equipment | 0.8 | 0.2 | 1.2 | 3.3 | 10.4 | 7.3 |
| Construction Supplies | 0.2 | -0.2 | -5.3 | -2.5 | 2.2 | 4.5 |
| Utilities | -1.8 | 2.2 | 2.6 | 3.3 | -0.6 | 2.1 |
| Capacity Utilization | 79.9 | 79.8 | 81.4 | 81.0 | 80.9 | 80.2 |
by Tom Moeller August 15, 2008
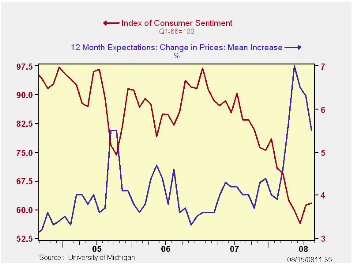
The University of Michigan's mid-August reading of consumer sentiment ticked up 0.8% from July to 61.7. The gain followed the 8.5% increase in July and the level about matched Consensus expectations for a reading of 62.0. The latest level of sentiment was the highest since March.
During the last ten years there has been a 47% correlation between the level of sentiment and the three month change in real consumer spending.
The expectations component of overall sentiment led the August improvement with a 6.2% rise after the 8.7% increase during July. Expectations for business conditions during the next year rose again as did expectations for conditions during the next five years. They made up nearly all of a sharp July decline.The expected change in personal finances fell modestly after a strong July increase.
The current conditions index was weak and fell 5.2%. That reversed most of the improvement during July. The decline was due to a sharp decline in the index of whether now is a good time to buy large household goods. It reversed the strength in the July reading. The view of current personal finances also fell (-31.1% y/y) early this month.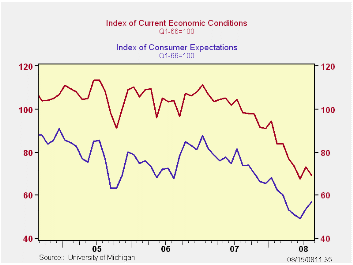
The opinion of government policy, which apparently influences economic expectations, stabilized after a sharp decline in July. Only seven percent of respondents thought that a good job was being done.
The mean expected rate of inflation during the next twelve months fell further to 5.5%. During the next five years, however, the expected inflation rate rose to 3.8% .
The University of Michigan survey is not seasonally adjusted.The reading is based on telephone interviews with about 500 households at month-end; the mid-month results are based on about 300 interviews. The summary indexes are in Haver's USECON database, with details in the proprietary UMSCA database.
How Much Have U.S. House Prices Fallen? from the Federal Reserve Bank of St. Louis is available here.
| University of Michigan | August (Prelim.) | July | June | Aug. y/y | 2007 | 2006 | 2005 |
|---|---|---|---|---|---|---|---|
| Consumer Sentiment | 61.7 | 61.2 | 56.4 | -26.0% | 85.6 | 87.3 | 88.5 |
| Current Conditions | 69.3 | 73.1 | 67.6 | -29.6% | 101.2 | 105.1 | 105.9 |
| Expectations | 56.8 | 53.5 | 49.2 | -22.9% | 75.6 | 75.9 | 77.4 |

Tom Moeller
AuthorMore in Author Profile »Prior to joining Haver Analytics in 2000, Mr. Moeller worked as the Economist at Chancellor Capital Management from 1985 to 1999. There, he developed comprehensive economic forecasts and interpreted economic data for equity and fixed income portfolio managers. Also at Chancellor, Mr. Moeller worked as an equity analyst and was responsible for researching and rating companies in the economically sensitive automobile and housing industries for investment in Chancellor’s equity portfolio. Prior to joining Chancellor, Mr. Moeller was an Economist at Citibank from 1979 to 1984. He also analyzed pricing behavior in the metals industry for the Council on Wage and Price Stability in Washington, D.C. In 1999, Mr. Moeller received the award for most accurate forecast from the Forecasters' Club of New York. From 1990 to 1992 he was President of the New York Association for Business Economists. Mr. Moeller earned an M.B.A. in Finance from Fordham University, where he graduated in 1987. He holds a Bachelor of Arts in Economics from George Washington University.
More Economy in Brief


