 Global| Nov 19 2007
U.S. Empire State Index Off Modestly, Expectations Plummet
by:Tom Moeller
|in:Economy in Brief
Summary
The index of manufacturing activity in New York State for November fell modestly to 27.37 from 28.75 last month which was its highest level in three years. The figures are reported by the Federal Reserve Bank of New York. Since the [...]
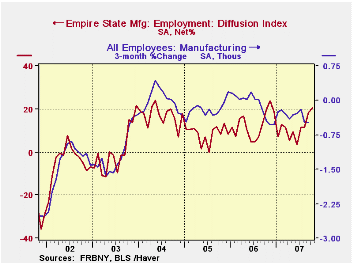
The index of manufacturing activity in New York State for November fell modestly to 27.37 from 28.75 last month which was its highest level in three years. The figures are reported by the Federal Reserve Bank of New York.
Since the series' inception in 2001 there has been a 55% correlation between the index level and the three month change in U.S. factory sector industrial production.
All of the overall indexes component fell at least slightly, including new orders and employment, but shipment improves slightly.
In the (perhaps too) short six year history of the NY employment index, there has been an 85% correlation between it level and the three month growth in overall factory sector employment.
Like the Philadelphia Fed Index of General Business
Conditions, the Empire State Business Conditions Index reflects answers
to an independent survey question; it is not a weighted combination of
the components. Last week, the Federal Reserve Bank of Philadelphia
reported slight improvement in its November General Business Conditions
index of activity in the factory sector.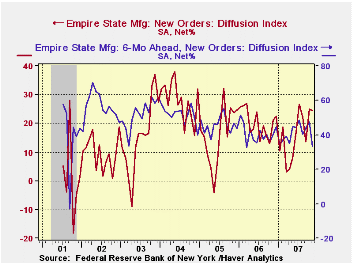
Pricing pressure again improved, for November to nearly its highest level since the Summer of last year. Since 2001 there has been an 81% correlation between the index of prices paid and the three month change in the core intermediate materials PPI.
The Empire State index of expected business conditions in six months plummeted and fell to its lowest level since the recession of 2001. Expectations for new orders and shipments fell most precipitously, but expectations for employment, capital spending and technology spending also fell sharply.
The Empire State Manufacturing Survey is a monthly survey of manufacturers in New York State conducted by the Federal Reserve Bank of New York. Participants from across the state in a variety of industries respond to a questionnaire and report the change in a variety of indicators from the previous month. Respondents also state the likely direction of these same indicators six months ahead. April 2002 is the first report, although survey data date back to July 2001.
For more on the Empire State Manufacturing Survey, including methodologies and the latest report, click here.
Monetary Policy under Uncertainty is today's speech by Federal Reserve Board Chairman Ben S. Bernanke and it is available here.
| Empire State Manufacturing Survey | November | October | Nov. '06 | 2006 | 2005 | 2004 |
|---|---|---|---|---|---|---|
| General Business Conditions (diffusion index) | 27.37 | 28.75 | 25.00 | 20.33 | 15.62 | 28.70 |
| Prices Paid | 42.86 | 36.05 | 34.90 | 41.88 | 44.74 | 50.50 |
by Tom Moeller November 19, 2007
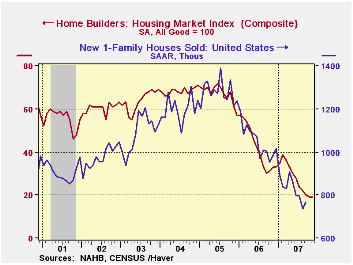
The Composite Housing Market Index from the National Association of Home Builders' (NAHB) at 19 in November remained stable, near record lows, m/m versus the downwardly revised level of the prior month.
The index rose very slightly m/m in most areas of the country
but fell sharply (-52.5% y/y) in the South.
During the last twenty years there has been a 76% correlation
between the y/y change in the Composite Index and the change in single
family housing starts.
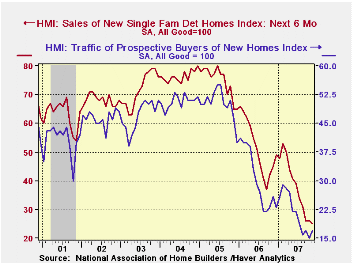
The sub-index from the NAHB for current sales (-45.5% y/y) and prospective sales in the next six months (-44.4% y/y) were both roughly stable m/m.
Similarly, traffic of prospective home buyers was up very slightly m/m bu remained down 41% from this past February's high.
The NAHB index is a diffusion index based on a survey of
builders. Readings above 50 signal that more builders view conditions
good than poor.
Visit the National Association of Home Builders.
The Decline in the U.S. Personal Saving Rate: Is It Real and Is It a Puzzle? from the Federal Reserve Bank of St. Louis is available here.
| Nat'l Association of Home Builders | November | October | Nov. '06 | 2006 | 2005 | 2004 |
|---|---|---|---|---|---|---|
| Composite Housing Market Index | 19 | 19 | 33 | 42 | 67 | 68 |
by Robert Brusca November 19, 2007
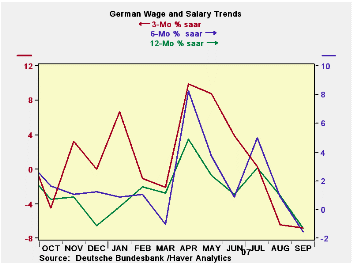
German wages and salaries are losing momentum. In inflation-adjusted terms the slow down is substantial and has turned real trends negative over the past year. The downward pressure is not abating. In September nominal wages and salaries per hour (including construction) fell by 0.7%. In that same month the HICP rose by 0.7%. The real wage dropped by 1.4% a bit slower than their 2% drop in August but more severe than in July - all are m/m calculations. Yr/Yr nominal wages and salaries per hour are lower by 1.3%; in real terms they are lower by a stunning 4%. Over three months the annualized rate of decline is greater still.
| German Wage and Salary Trends | ||||||
|---|---|---|---|---|---|---|
| Sep-07 | Aug-07 | Jul-07 | 3-Mo | 6-Mo | 12-Mo | |
| Wages & Salaries | -0.7% | -2.1% | 1.0% | -6.8% | -1.6% | -1.3% |
| Real Wages & Salaries | -1.4% | -2.0% | 0.9% | -9.9% | -4.7% | -4.0% |
| Wages & Salaries less HICP on same tenor | ||||||
by Louise Curley November 19, 2007
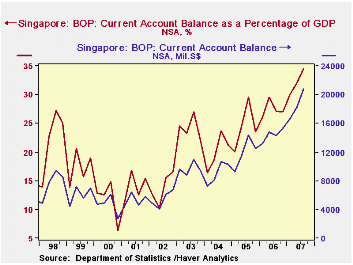
Singapore's current account continues to climb. In the third quarter, it was S$20,773 mil. on a seasonally unadjusted basis compared with S$18,263 million in the second quarter and S$14,289 million in the third quarter of 2006. The current account balance was 34% of Gross Domestic Product in the third quarter. The first chart shows the rise in the current account and in its percentage of GDP.
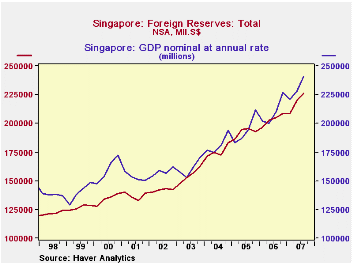
The combined capital and financial account continues to be much smaller than the current account with the result that Singapore' foreign reserves continue to pile up. In the third quarter after allowing for -S$2,634 million of errors and omissions, reserves were increased by S$6,031 million. At the end of the quarter foreign reserves amounted to S$226 billion. Since mid 2003, reserves have been close in amount to the annual rate of Singapore's Gross Domestic Product in nominal terms, as shown in the second chart.
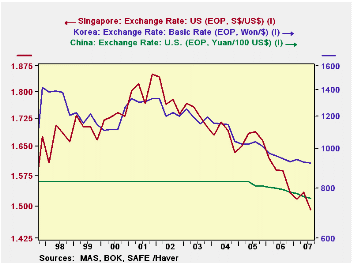
Singapore in contrast to some of the other Pacific Rim countries who are accumulating reserves, has been more relaxed about letting its currency appreciate relative to the dollar. The dollar exchange rates of China, Japan and Singapore are shown in the third chart. The data are plotted on a log scale where the slope of data represents equal percentage changes. Thus the steep decline in the number of Singapore dollars to the U. S. dollar shows a greater appreciation to the dollar than the Japanese yen or the Chinese yuan.
| SINGAPORE BALANCE OF PAYMENTS (NSA, Mil of S$) | Q3 07 | Q2 07 | Q1 07 | Q4 06 | Q3 06 | 2006 | 2005 | 2004 |
|---|---|---|---|---|---|---|---|---|
| Current Account | 20773 | 18263 | 16603 | 15317 | 14289 | 57661 | 47616 | 36414 |
| Capital and Financial Account | -12108 | -7744 | -13496 | -8518 | -9078 | -33262 | -31923 | -12868 |
| Net Errors and Omissions | -2634 | -1383 | -1592 | 2688 | -1205 | 2597 | 4703 | -3077 |
| Change in Reserves* | -6031 | -9136 | -1515 | -9487 | -4006 | -26996 | -20397 | -20468.9 |
| Total Reserves | 226290 | 220503 | 208876 | 208992 | 205096 | 208992 | 182813 | 183467 |

Tom Moeller
AuthorMore in Author Profile »Prior to joining Haver Analytics in 2000, Mr. Moeller worked as the Economist at Chancellor Capital Management from 1985 to 1999. There, he developed comprehensive economic forecasts and interpreted economic data for equity and fixed income portfolio managers. Also at Chancellor, Mr. Moeller worked as an equity analyst and was responsible for researching and rating companies in the economically sensitive automobile and housing industries for investment in Chancellor’s equity portfolio. Prior to joining Chancellor, Mr. Moeller was an Economist at Citibank from 1979 to 1984. He also analyzed pricing behavior in the metals industry for the Council on Wage and Price Stability in Washington, D.C. In 1999, Mr. Moeller received the award for most accurate forecast from the Forecasters' Club of New York. From 1990 to 1992 he was President of the New York Association for Business Economists. Mr. Moeller earned an M.B.A. in Finance from Fordham University, where he graduated in 1987. He holds a Bachelor of Arts in Economics from George Washington University.
More Economy in Brief


