 Global| Jun 16 2008
U.S. Empire State Index Negative Again
by:Tom Moeller
|in:Economy in Brief
Summary
The Federal Reserve Bank of New York reported that its June index of manufacturing activity, in the Empire State, fell further into negative territory. The decline to -8.68 followed an unrevised -3.23 during May and it was the fourth [...]
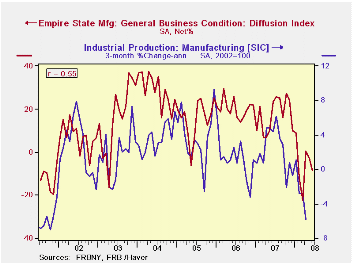
The Federal Reserve Bank of New York reported that its June index of manufacturing activity, in the Empire State, fell further into negative territory. The decline to -8.68 followed an unrevised -3.23 during May and it was the fourth negative reading this year. A less negative reading of -1.8 for June had been the Consensus expectation.
The figure is a diffusion index. Since the series' inception in 2001 there has been a 55% correlation between the index level and the three-month change in U.S. factory sector industrial production.
Most of the index's components were negative with the
shipments index, at -6.54, at its lowest level since the recession of
2001. The new orders index, at -5.48, was at its lowest level since
February.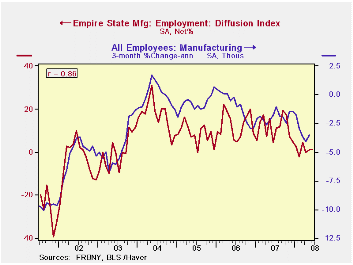
The employment rose remained slightly positive at a low 1.16. In the (perhaps too) short seven year history of the NY employment index, there has been an 86% correlation between it and the three-month growth in overall factory sector employment.
Like the Philadelphia Fed Index of General Business Conditions, the Empire State Business Conditions Index reflects answers to an independent survey question; it is not a weighted combination of the components.
Pricing pressure eased slightly m/m to a reading of 66.28 but
that still was near its record high reached last month. The latest
index level was 66.28. Since the series' inception in 2001 there has
been an 81% correlation between the index of prices paid and the
three-month change in the core intermediate materials PPI.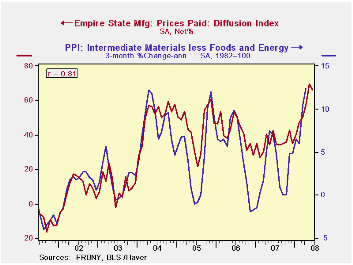
Core Inflation: A Review of Some Conceptual Tools from the Federal Reserve Bank of St. Louis is available here.
The Empire State index of expected business conditions in six months improved further following its May increase and was at the highest level since December.
The Empire State Manufacturing Survey is a monthly survey of manufacturers in New York State conducted by the Federal Reserve Bank of New York. Participants from across the state in a variety of industries respond to a questionnaire and report the change in a variety of indicators from the previous month. Respondents also state the likely direction of these same indicators six months ahead.
For more on the Empire State Manufacturing Survey, including methodologies and the latest report, click here.
Big, Not Better? from the Centre for Policy Studies in London can be found here?
| Empire State Manufacturing Survey | June | May | June '07 | 2007 | 2006 | 2005 |
|---|---|---|---|---|---|---|
| General Business Conditions (diffusion index, %) | -8.68 | -3.23 | 23.48 | 17.23 | 20.24 | 15.53 |
| Prices Paid | 66.28 | 69.57 | 42.55 | 35.64 | 41.88 | 44.74 |
by Tom Moeller June 16, 2008
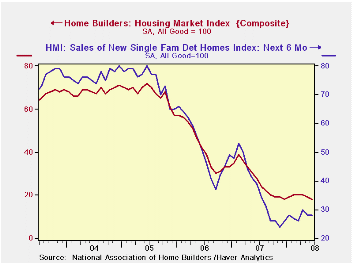
The National Association of Home Builders' (NAHB) indicated
that its Composite Housing Market Index in June fell slightly to 18
from 19 in May. So far this year, the series has shown some signs of
stability, averaging 18, 20 and 18 during the last three quarters.
Nevertheless, the levels are more than two-thirds lower than the highs
of 2004.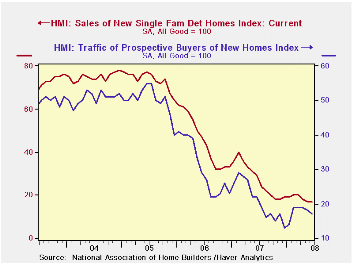
During the last twenty years there has been a 76% correlation between the y/y change in the Composite Index and the change in single family housing starts.
The index for single family detached homes in June was stable month-to-month but the 2Q average level still was near the series' 20-year low. Builders saw modest improvement in single family home sales during the next six months, up from the lows of the prior two quarters.
Despite modest improvement in the builders' index in most of the country's regions, continued decline was registered in the Northeast.
Traffic of prospective home buyers remained quite low.
The NAHB index is a diffusion index based on a survey of builders. Readings above 50 signal that more builders view conditions good than poor.
Visit the National Association of Home Builders.
| Nat'l Association of Home Builders | June | May | June '07 | 2007 | 2006 | 2005 |
|---|---|---|---|---|---|---|
| Composite Housing Market Index | 18 | 19 | 28 | 27 | 42 | 67 |
by Robert Brusca June 16, 2008

Ever since Germany revised up its preliminary HICP for May the
EMU HICP preliminary result has been on notice for an upward revision
too. Today that rate was revised up to 3.7% from 3.6%, a small uptick,
yes, but in the wrong direction and at the wrong time. The ECB already
is very concerned about inflation and recent labor market activity saw
wage inflation rise to 2.7% in 2008-Q1 from a pace of 2.2% in 2007-Q4.
Various ECB commentators keep reminding us that the ECB could raise
rates at its next meeting.
Still the ECB is doing well, as well as can be expected, on
inflation. Its ‘core’ inflation rate, what we could call core ex-sin
inflation since it excludes alcohol and tobacco as well, is under
control. On this measure the ECB is doing well as inflation on this
core measure ticked up to 1.7% from 1.6% previously. It stands under
the ECB’s ceiling rate much as the Core CPI in the US stands inside the
Fed’s so-called comfort zone. Except the ECB has NO SEPARATE ceiling
for core inflation. So, to the ECB, this moderate core pace is no cause
to celebrate, at least not in public.
Last week we heard from two ECB members on the subject of
prospective ECB rate hikes. Jurgin Stark, a notable hawk, said that the
ECB was not planning a series of rate hikes.
What I infer from all this ECB jockeying around is that
inflation in the zone is actually quite contained apart from the
uncontrollable short term commodity prices that are in the mix.. The
ECB has a ceiling rate at 2% and has been violating it for far too
long. It feels, for credibility’s sake, it must do something. It has
been prevailed upon to defer hiking rates while the banking crisis was
so bad but now it will do something.
Still the ECB is not under any illusions. It knows that it
cannot in any quick way get inflation back below its ceiling as long as
we are in such a strong transition period for oil prices. To try and
squeeze inflation back to 2% in a short period would be more forceful
and act for the economy than even the old Bundesbank would have
contemplated.
It seems that the ECB has opted to live with the inflation
overshoot and to hike rates again to give a clear signal that it is
still fighting to reduce the rate of inflation. Its rhetoric may
continue after the rate hike since the ECB is desperately concerned
with getting control of inflation again and with anchoring inflation
expectations. In the meantime it must at least continue to posture
against the overshoot with verbiage and maybe even occasional actions
if the price shocks continue. But there is no program of rate
tightening in store that is intended to corral the rogue HICP headline.
Energy’s dramatic rise makes that strategy simply too dangerous even
for the world class inflation hawks.
| Trends in HICP | |||||||
|---|---|---|---|---|---|---|---|
| % mo/mo | % saar | ||||||
| May-08 | Apr-08 | Mar-08 | 3-Mo | 6-Mo | 12-Mo | Yr Ago | |
| EMU-13 | 0.6% | 0.0% | 0.5% | 4.2% | 3.5% | 3.7% | 1.9% |
| Core | 0.2% | -0.1% | 0.4% | 2.3% | 2.5% | 2.4% | 1.9% |
| Goods | 0.8% | 0.6% | 1.4% | 11.8% | 5.3% | 4.5% | 1.4% |
| Services | 0.4% | -0.1% | 0.4% | 2.6% | 3.7% | 2.5% | 2.6% |
| HICP | |||||||
| Germany | 0.6% | -0.4% | 0.4% | 2.3% | 1.9% | 3.0% | 2.0% |
| France | 0.5% | 0.1% | 0.5% | 4.6% | 3.8% | 3.7% | 1.1% |
| Italy | 0.4% | 0.0% | 0.6% | 3.8% | 4.0% | 3.7% | 1.9% |
| Spain | 0.7% | -0.1% | 0.4% | 4.1% | 4.3% | 4.7% | 2.4% |
| Core excl Food Energy & Alcohol | |||||||
| Germany | 0.3% | -0.5% | 0.4% | 0.8% | 1.2% | 1.8% | 2.1% |
| France | 0.1% | 0.1% | 0.4% | 2.4% | 2.6% | 2.4% | 1.4% |
| Italy | 0.2% | -0.1% | 0.7% | 3.1% | 2.9% | 2.7% | 1.9% |
| Spain | 0.3% | -0.1% | 0.3% | 2.2% | 2.7% | 3.3% | 2.5% |
by Louise Curley June 16,2008
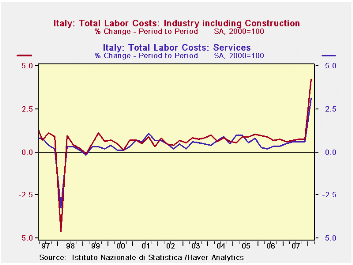
On a seasonally adjusted basis, total labor costs in Italy
increased by 4.0% in the first quarter of 2008. This was the largest
quarter to quarter increase in the history of the series, which extends
back to the first quarter of 1996. Labor costs in industry, including
construction rose 4.2% and those in the services rose 3.2%. These are
also record increases as shown in the first chart.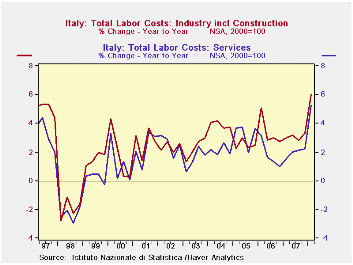
On a seasonally unadjusted basis the year to year increase in total labor costs was 5.6% in the first quarter, Labor costs in industry including construction were up 6.0% on a year to year basis and labor costs in services were up 5.3%. Again these increases are the largest ever recorded as can be seen in the second chart.
The unadjusted data provide more information on the trends in labor costs in particular industries and services. The rise in labor costs was particularly marked in financial intermediation services, which rose 14% on a year to year basis in the first quarter. Among other services, labor costs in transport, storage and communication were up 5.1% on a year to year basis. Labor costs in the wholesale, retail trade and repairs were among the smallest increases,3.6%. In the industry sector, labor costs in the electric gas and water supply sector rose 7.1%, in manufacturing, 6.4% and in construction, 4.6%.
| ITALY | Q1 08 | Q4 07 | Q1 07 | Q/Q Chg | Y/Y Chg | 2007 | 2006 | 2005 |
|---|---|---|---|---|---|---|---|---|
| Labor Costs (SA) (2000=100) | ||||||||
| Total Industry and Services | 125.4 | 120.6 | 118.5 | 3.98 | -- | 119.6 | 116.9 | 113.8 |
| Industry Incl. Construction | 128.6 | 123.4 | 120.8 | 4.21 | -- | 122.1 | 118.8 | 114.6 |
| Services | 121.3 | 117.6 | 115.5 | 3.15 | -- | 116.6 | 114.3 | 112.3 |
| Labor Costs (NSA) (2000=100) | ||||||||
| Total Industry and Services | 116.2 | 137.4 | 110.0 | -- | 5.64 | 119.6 | 116.9 | 113.8 |
| Industry Incl. Construction | 119.9 | 142.2 | 113.1 | -- | 6.01 | 122.1 | 118.4 | 114.6 |
| Services | 112.1 | 132.2 | 106.3 | -- | 5.26 | 116.6 | 114.3 | 112.3 |
| Manufacturing | 121.0 | 146.7 | 113.7 | -- | 6.42 | 123.6 | 119.8 | 115.5 |
| Electricity, Gas and Water | 114.1 | 129.3 | 106.5 | -- | 7.14 | 122.3 | 117.6 | 114.0 |
| Construction | 124.5 | 136.6 | 119.0 | -- | 4.62 | 124.1 | 119.7 | 116.6 |
| Wholesale and Retail Trade | 110.0 | 136.8 | 106.2 | -- | 3.58 | 119.4 | 116.0 | 114.1 |
| Financial Intermediation | 129.2 | 135.9 | 113.2 | -- | 14.13 | 122.6 | 120.4 | 120.0 |

Tom Moeller
AuthorMore in Author Profile »Prior to joining Haver Analytics in 2000, Mr. Moeller worked as the Economist at Chancellor Capital Management from 1985 to 1999. There, he developed comprehensive economic forecasts and interpreted economic data for equity and fixed income portfolio managers. Also at Chancellor, Mr. Moeller worked as an equity analyst and was responsible for researching and rating companies in the economically sensitive automobile and housing industries for investment in Chancellor’s equity portfolio. Prior to joining Chancellor, Mr. Moeller was an Economist at Citibank from 1979 to 1984. He also analyzed pricing behavior in the metals industry for the Council on Wage and Price Stability in Washington, D.C. In 1999, Mr. Moeller received the award for most accurate forecast from the Forecasters' Club of New York. From 1990 to 1992 he was President of the New York Association for Business Economists. Mr. Moeller earned an M.B.A. in Finance from Fordham University, where he graduated in 1987. He holds a Bachelor of Arts in Economics from George Washington University.
More Economy in Brief


