 Global| Jun 25 2008
U.S. Durable Goods Orders Unchanged in May; Downtrend Underscores Factory Sector Woes
by:Tom Moeller
|in:Economy in Brief
Summary
New orders for durable manufactured goods matched expectations and were unchanged last month. The result followed a downwardly revised 1.0% drop in April. The year-to-year change in orders fell to -1.5% after a modest 1.4% rise last [...]
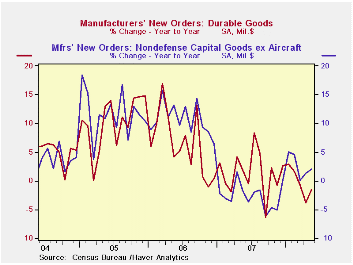
New orders for durable manufactured goods matched expectations and were unchanged last month. The result followed a downwardly revised 1.0% drop in April. The year-to-year change in orders fell to -1.5% after a modest 1.4% rise last year, a 6.2% rise in 2006 and 10.2% growth during 2005.
Weakness in orders for transportation equipment continued to
account for much of this year's weakness in total durables orders,
notwithstanding a 2.6% rise last month. Orders for transportation
equipment are down at a 16.9% rate so far this year. Lower orders for
motor vehicles & parts account for much of that weakness with a
20.5% y/y decline after last year's 4.7% drop. But orders for
nondefense aircraft have eased as well and the y/y growth rate fell to
-0.4% in May after a 44.9% increase during 2007. Less the
transportation sector overall orders rose 0.8% this year but that
followed a 0.3% decline in 2007.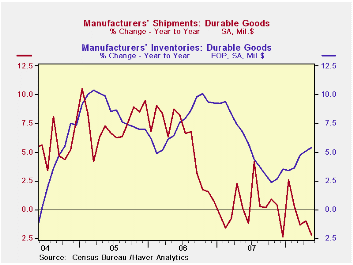
Orders for nondefense capital goods overall rose 0.4% in May lifted by orders for nondefense aircraft which rose 10.3%. However the momentum here has changed and y/y growth in May aircraft orders fell to -0.4% after last year's 44.9% surge. Less aircraft capital goods orders fell 0.8% and they are down 1.1% (AR) so far this year. During the last ten years there has been an 80% correlation between the y/y gain in nondefense capital goods orders and the rise in equipment & software spending in the GDP accounts. The correlation with capital goods shipments is, as one would expect, a larger 92%.
Orders for machinery fell 5.3% (+8.1% y/y) and that reversed all of an April increase. Year-to-date machinery orders fell 4.8% after last year's 0.6% uptick and 9.1% growth during 2006. New orders for electrical equipment, appliances & components rose 1.5% but y/y growth of 2.7% followed last year's moderate 3.3% gain.Orders for computers & related products just offset an April decline and rose 2.0% (-2.4% y/y). New orders for communications equipment rose 2.4% last month but an April increase was revised away and these orders are down 7.4% year-to-date.
Overall shipments of durable goods fell 1.1% and are unchanged this year. Less the transportation sector shipments fell 0.2% but that belies a 6.1% year-to-date increase. That is due mostly to a 21.2% rise in shipments of primary metals.
Inventories of durable goods rose 0.4% during May and year-to-date inventories have increased 3.0% following last year's 3.5% rise. Less transportation, inventories rose 0.3% last month. The 2.1% rise so far this year follows 1.4% growth last year.
Has Inventory Volatility Returned? A Look at the Current Cycle from the Federal Reserve Bank of New York can be found here.
| NAICS Classification | May | April | Y/Y | 2007 | 2006 | 2005 |
|---|---|---|---|---|---|---|
| Durable Goods Orders | 0.0% | -1.0% | -1.5% | 1.4% | 6.2% | 10.2% |
| Excluding Transportation | -0.9% | 1.9% | 1.4% | -0.3% | 9.1% | 9.1% |
| Nondefense Capital Goods | 0.4% | -2.4% | 1.1% | 3.5% | 9.4% | 17.3% |
| Excluding Aircraft | -0.8% | 3.1% | 2.0% | -2.7% | 10.7% | 11.6% |
by Tom Moeller June 25, 2008
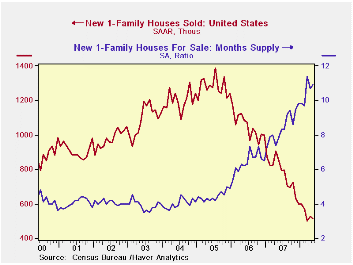
Sales new single-family homes fell 2.5% to 512,000 and reversed roughly half of the prior month's increase. Sales were down 63.1% from their July 2005 peak. The decline about matched expectations for a level of 514,000.
Overall sales were near their lowest level since 1991 with the worst performance shown by sales in the Midwest and in the Western regions of the country.
The greatest sales decline in May was for homes selling in the
$300,000 to $399,000 price range while an increase was logged for
lesser priced homes, priced below the $150,000 level.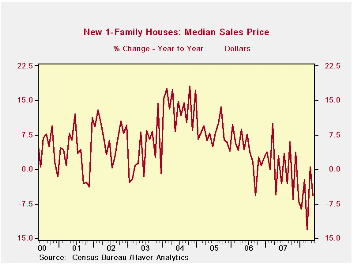
By region, May sales declined most significantly in the Northeast and in the West. In the South sales were about unchanged and they rose somewhat in the Midwest.
The median price for a new single-family home fell 5.1% to
$231,000 from an upwardly revised April level.
The number of new homes for sale fell 2.0% (-17.3%y/y) and reduced the inventory of unsold homes to the lowest level since 2005. The decline in the number of unsold homes has been greatest in the West (-22.9% y/y) and the declines elsewhere in the country about equal the totals' figure.
The month's supply of new homes for sale again ticked lower
m/m but remained near the cycle's high.
| US New Homes | May | April | Y/Y | 2007 | 2006 | 2005 |
|---|---|---|---|---|---|---|
| Total Sales (SAAR, 000s) | 512 | 525 | -40.3% | 768 | 1,049 | 1,279 |
| Northeast | 35 | 38 | -57.8 | 64 | 64 | 81 |
| Midwest | 82 | 78 | -42.3 | 118 | 161 | 203 |
| South | 281 | 280 | -35.0 | 408 | 559 | 638 |
| West | 114 | 129 | -43.0 | 178 | 266 | 356 |
| Median Price (NSA, $) | 231,000 | 243,500 | -5.7 | 243,742 | 243,067 | 234,208 |
by Robert Brusca June 25, 2008
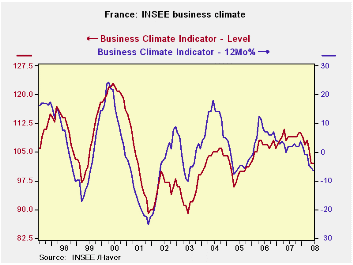
French business confidence in June is flat at its May level
and is just above its long term average. As such it stands in the 58th
percentile of its range in June. Orders, both domestic and foreign,
slipped in the month but the two series still rank in the 56 to 57
percentiles of their respective ranges. That is a bit above mid-range.
A reading of 50 is neutral. French businesses still see a lot of price
pressure as the index for prices held at 14 which is at the 78th
percentile of its range. As to production, the recent trend is sub par
at -15; it ranks in the 42nd percentile, below the range mid-point. But
the likely trend is firm in the 56th percentile reading on a +7 raw
reading.
French businesses are not so wary of the future. They are
undeterred apparently by the strong euro, the expected ECB rate hike,
rising inflation prospects, financial turmoil and a weakening global
economy. The survey participants remain upbeat.
| INSEE Industry Survey | ||||||||||
|---|---|---|---|---|---|---|---|---|---|---|
| Since Jan 1990 | Since Jan 1990 | |||||||||
| Jun 08 |
May 08 |
Apr 08 |
Mar 08 |
Percentile | Rank | Max | Min | Range | Mean | |
| Climate | 102 | 102 | 106 | 108 | 58.0 | 106 | 123 | 73 | 50 | 101 |
| Production | ||||||||||
| Recent Trend | -15 | -14 | -7 | -6 | 42.2 | 140 | 44 | -58 | 102 | -5 |
| Likely trend | 7 | 6 | 13 | 14 | 56.6 | 113 | 30 | -23 | 53 | 6 |
| Orders/Demand | ||||||||||
| Orders & Demand | -13 | -10 | -5 | 1 | 56.3 | 100 | 25 | -62 | 87 | -14 |
| Foreign Orders & Demand | -7 | -6 | 3 | 1 | 57.3 | 96 | 31 | -58 | 89 | -10 |
| Prices | ||||||||||
| Likely Sales Price Trend | 14 | 14 | 14 | 12 | 78.7 | 20 | 24 | -23 | 47 | 1 |
by Robert Brusca June 25, 2008
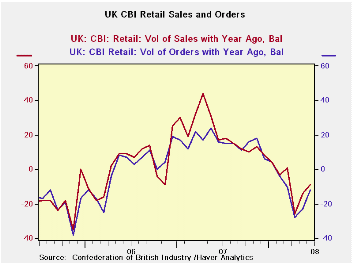
The CBI net balance diffusion presentation of its survey shows
that sales in June were not as weak compared to a year ago as they were
in May. But at -9 the result was still in the bottom quartile of the
survey’s range of experience and compares to an average response of +2.
Similarly orders at -12 were only ‘half as bad’ as the May result but
still registered in the lower 30% of their range. Some of this may have
been seasonal since sales for the ‘time of year’ scored a net reading
of -21 close to last month’s -25 reading, Inventories relative to sales
were elevated and stand in the 73rd percentile of their range.
The outlook for July is grim. At -7 the reading is loads worse
that the expectation of +6 that had been in place for June. Orders at
-13 are much weaker than June’s expectation for -2. Sales for the time
of year are expected to worsen to -17 compared to a -14 expectation for
June but an actual reading of -21 that emerged. Merchants appear to be
still downplaying the risk or maybe that is just normal bias, on their
part. The point is that the expectation for sales for the ‘time of
year’ is lower in July than it was in June so a worsening is expected
at least on that basis.
| UK Retail volume data CBI Survey | |||||||||
|---|---|---|---|---|---|---|---|---|---|
| Reported: | Jul-08 | Jun-08 | May-08 | Apr-08 | 12MO Avg | Pcntle | Max | Min | Range |
| Sales/Yr Ago | -- | -9 | -14 | -26 | 2 | 25% | 67 | -35 | 102 |
| Orders/Yr Ago | -- | -12 | -23 | -28 | 1 | 30% | 48 | -38 | 86 |
| Sales: Time/Yr | -- | -21 | -25 | -38 | -12 | 29% | 41 | -46 | 87 |
| Stocks:Sales | -- | 22 | 22 | 17 | 16 | 73% | 30 | 0 | 30 |
| Expected: | Jul-08 | ||||||||
| Sales/Yr Ago | -7 | 6 | -15 | -3 | 5 | 18% | 67 | -23 | 90 |
| Orders/Yr Ago | -13 | -2 | -14 | -6 | 2 | 26% | 47 | -34 | 81 |
| Sales: Time/Yr | -17 | -14 | -26 | -15 | -9 | 23% | 45 | -35 | 80 |
| Stocks:Sales | 13 | 16 | 18 | 11 | 12 | 43% | 26 | 3 | 23 |
by Tom Moeller June 25, 2008
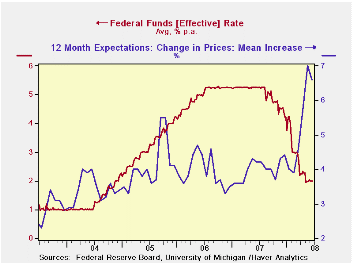
As widely expected, the Federal Open Market Committee left the Federal funds rate unchanged today at 2.00%. The Fed had been steadily lowering the rate since its high of 6.25% in July of last year, where it had been for roughly 12 months.
The discount rate also was left unchanged at 2.25%.
Regarding the economy the Fed indicated "that overall economic
activity continues to expand, partly reflecting some firming in
household spending." To the downside was noted a greater number of
risks that "labor markets have softened further and financial markets
remain under considerable stress. Tight credit conditions, the ongoing
housing contraction, and the rise in energy prices are likely to weigh
on economic growth over the next few quarters."
Regarding price inflation it was stated that the "Committee expects inflation to moderate later this year and next year." However risks to this outlook were deemed high given an elevated level of energy, other commodity prices and inflation expectations.
The Fed's statement indicated that the downside risks to economic growth have diminished and that the upside risks to inflation have increased.
The decision was unanimous except that Richard W. Fisher, President of the Federal Reserve Bank of Dallas, preferred an increase in the target for the federal funds rate at this meeting.
For the complete text of the Fed's latest press release please follow this link here.
Liquidity Crisis from the Federal Reserve Bank of Philadelphia can be found here.
| Current | Last | May | 2007 | 2006 | 2005 | |
|---|---|---|---|---|---|---|
| Federal Funds Rate, % (Target) | 2.00 | 2.00 | 1.98 | 5.02 | 4.96 | 3.19 |
| Discount Rate, % | 2.25 | 2.25 | 2.25 | 5.86 | 5.95 | 4.18 |

Tom Moeller
AuthorMore in Author Profile »Prior to joining Haver Analytics in 2000, Mr. Moeller worked as the Economist at Chancellor Capital Management from 1985 to 1999. There, he developed comprehensive economic forecasts and interpreted economic data for equity and fixed income portfolio managers. Also at Chancellor, Mr. Moeller worked as an equity analyst and was responsible for researching and rating companies in the economically sensitive automobile and housing industries for investment in Chancellor’s equity portfolio. Prior to joining Chancellor, Mr. Moeller was an Economist at Citibank from 1979 to 1984. He also analyzed pricing behavior in the metals industry for the Council on Wage and Price Stability in Washington, D.C. In 1999, Mr. Moeller received the award for most accurate forecast from the Forecasters' Club of New York. From 1990 to 1992 he was President of the New York Association for Business Economists. Mr. Moeller earned an M.B.A. in Finance from Fordham University, where he graduated in 1987. He holds a Bachelor of Arts in Economics from George Washington University.
More Economy in Brief


