 Global| Jul 25 2008
U.S. Durable Goods Orders Rose. Less Transportation Orders Jumped
by:Tom Moeller
|in:Economy in Brief
Summary
Orders for durable goods rose 0.8% last month and the increase followed a 0.1% uptick during May. Consensus expectations had been for a 0.4% decline during June. The figures of late, however, have been very much influenced by weakness [...]
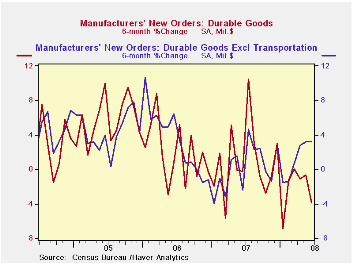
Orders for durable goods rose 0.8% last month and the increase followed a 0.1% uptick during May. Consensus expectations had been for a 0.4% decline during June. The figures of late, however, have been very much influenced by weakness in the transportation sector. Less transportation orders popped 2.0% during June and they have risen 6.2% during the past twelve months.
Lower orders for aircraft & parts dragged the June orders total down with a 20.3% decline (-30.4% y/y). That drop reflected an 8.6% shortfall (+53.6 y/y) in defense orders as well as a 25.1% drop (-45.2% y/y) in nondefense orders.
Orders for nondefense capital goods fell 3.2% last month but
this decline also reflected weakness in aircraft orders. Less aircraft,
nondefense capital goods orders rose 1.4% during June and these orders
have risen 1.6% since yearend. The y/y gain of 5.5% compares to a 2.7%
decline during all of last year. During the last ten years there has
been an 80% correlation between the y/y gain in nondefense capital
goods orders and the rise in equipment & software spending in
the GDP accounts. The correlation with capital goods shipments is, as
one would expect, a larger 92%.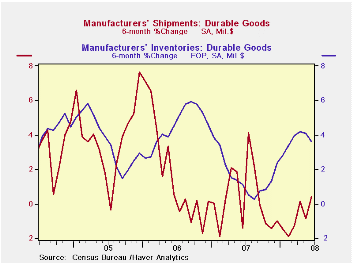
To the upside during June were primary metal orders. They surged 5.1% and are up 10.7% this year, 22.7% y/y. Orders for machinery recovered most of the prior month's decline with a 2.3% (11.8% y/y) rise during June. Year-to-date machinery orders are, however, only near last year's rate of gain with a 1.6% rise after last year's 0.6% uptick.Orders for computers & related products slipped 0.5% but they are up 1.1% so far this year. New orders for communications equipment reversed all of the prior month's rise with a 4.4% decline and they are down 4.7% so far this year.
Overall shipments of durable goods rose 0.5% and made up about half of the May decline. Less transportation shipments recovered all of the May decline with a 0.2% (2.6% y/y) uptick.
Inventories of durable goods rose 0.5% during June, about as they did during the prior two months. Year-to-date inventories increased 3.6%, about the same as they did last year. Less transportation inventories are up 2.5%, about as they were last year.
| NAICS Classification | June | May | Y/Y | 2007 | 2006 | 2005 |
|---|---|---|---|---|---|---|
| Durable Goods Orders | 0.8% | 0.1% | -1.1% | 1.4% | 6.2% | 10.2% |
| Excluding Transportation | 2.0% | -0.5% | 6.2% | -0.3% | 9.1% | 9.1% |
| Nondefense Capital Goods | -3.2% | 0.2% | -5.7% | 3.5% | 9.4% | 17.3% |
| Excluding Aircraft | 1.4% | -0.1% | 5.5% | -2.7% | 10.7% | 11.6% |
by Tom Moeller July 25, 2008
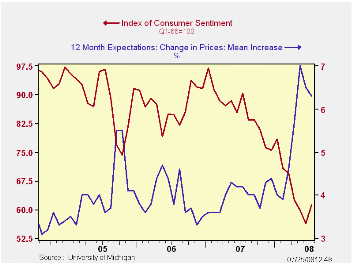
The University of Michigan's July reading of consumer sentiment rose 8.5% from June, an improvement from the read for early July which showed a 0.4% uptick versus the June average. The rise beat Consensus expectations for a reading of 56.3 which would have been unchanged from June. The latest level of sentiment was its highest since April.
During the last ten years there has been a 47% correlation
between the level of sentiment and the three month change in real
consumer spending.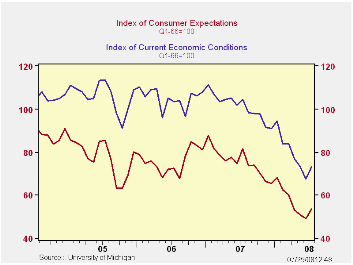
The expectations component of overall sentiment was much firmer than reported at mid-month. The full-month index rose 8.7% to its highest level since March led by a 9.4% rise (-16.0% y/y) in expectations for personal finances. Expectations for business conditions during the next year also were firm and expectations for conditions during the next five years made up about all of a sharp July decline.
The current conditions index rose 8.1% and recovered all of a decline during June. The rise was due to a sharp increase in the index of whether now is a good time to buy large household goods, to the highest level since March (-26.3% y/y). The view of current personal finances also rose and made about half of the June decline (-36.5% y/y).
The opinion of government policy, which apparently influences economic expectations, gave back about half of its June improvement.
The mean expected rate of inflation during the next twelve months slipped m/m to 6.3% versus an initial expectation for 6.9%. During the next five years the expected inflation rate fell further to 3.5%, the lowest level since April.
The University of Michigan survey is not seasonally adjusted.The reading is based on telephone interviews with about 500 households at month-end; the mid-month results are based on about 300 interviews. The summary indexes are in Haver's USECON database, with details in the proprietary UMSCA database.
| University of Michigan | July | (Prelim.) | June | May | July y/y | 2007 | 2006 | 2005 |
|---|---|---|---|---|---|---|---|---|
| Consumer Sentiment | 61.2 | 56.6 | 56.4 | 59.8 | -32.3% | 85.6 | 87.3 | 88.5 |
| Current Conditions | 73.1 | 69.5 | 67.6 | 73.3 | -30.0% | 101.2 | 105.1 | 105.9 |
| Expectations | 53.5 | 48.3 | 49.2 | 51.1 | -34.4% | 75.6 | 75.9 | 77.4 |
by Tom Moeller July 25, 2008
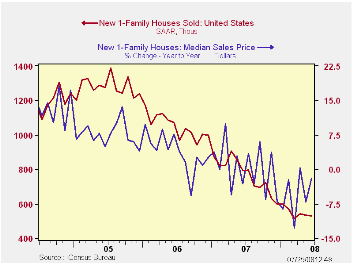
Sales new single-family homes in June dipped 0.6% to 530,000.
The fall added to a 1.7% drop during May that was a much shallower
decline than initially reported. The level of sales in June was down
61.8% from the July 2005 peak. Nevertheless, the latest level of sales
beat expectations for 503,000.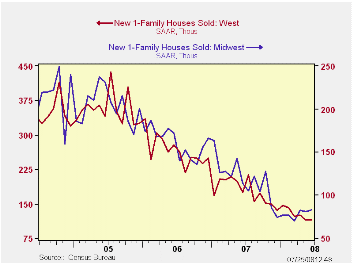
By region sales in the South fell 2.0% and they are down 12.5% since December. In the West sales dipped 0.9% and that resulted in a 15.6% drop so far this year. Though sales in the Northeast recovered the May decline with a 5.3% gain, they remained down 28.6% since December. In the Midwest June sales rose 2.5%. So far this year this has been the star performing region as sales posted a 12.2% increase.
The median price for a new single-family home increased 1.4%
to $230,900 after a 6.5% decline during May which was a deeper drop
than reported initially.
The number of new homes for sale fell 5.3% (-21.5% y/y) and reduced the inventory of unsold homes to the lowest level since December of 2004. The decline in the number of unsold homes has been greatest in the West (-23.9% y/y) but declines of similar magnitude have been logged elsewhere in the country.
The month's supply of new homes for sale again ticked lower
m/m to 10.0 but that remained near the cycle's high.
| US New Homes | June | May | Y/Y | 2007 | 2006 | 2005 |
|---|---|---|---|---|---|---|
| Total Sales (SAAR, 000s) | 530 | 533 | -33.2% | 768 | 1,049 | 1,279 |
| Northeast | 40 | 38 | -37.5 | 64 | 64 | 81 |
| Midwest | 83 | 81 | -27.2 | 118 | 161 | 203 |
| South | 293 | 299 | -33.4 | 408 | 559 | 638 |
| West | 114 | 115 | -34.9 | 178 | 266 | 356 |
| Median Price (NSA, $) | 230,900 | 227,700 | -2.0 | 243,742 | 243,067 | 234,208 |
by Robert Brusca July 25, 2008
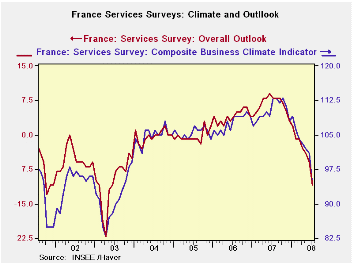
France’s formerly stable service sector is weakening: The
Insee indicator that was above its mean level just three short months
ago is now falling sharply. The service sector barometer is now in the
37th percentile of its range with the outlook in the 35th percentile of
its range at a reading of -11 compared with an average of -2.
Observed sales are in the 62nd percentile of that series’
historic range while expected sales are ominously in the 40th
percentile of their range. The future is expected to be worse. Sales
prices are in the high seventies to 8oth percentiles. While employment
observed over the past three-months was in the 80th percentile of this
historic range for the next three-months the reading for expected
employment conditions is in the bottom 20th percentile.
| France INSEE Services Survey Jan 2000-date | ||||||||||
|---|---|---|---|---|---|---|---|---|---|---|
| Jul 08 |
Jun 08 |
May 08 |
Apr 08 |
%tile | Rank | Max | Min | Range | Mean | |
| Climate Indicator | 94 | 101 | 102 | 103 | 36.7 | 68 | 113 | 83 | 30 | 102 |
| Climate: 3-Mo MAV | 99 | 102 | 103 | 104 | 50.6 | 55 | 113 | 85 | 28 | 102 |
| Climate: 12-Mo MAV | 106 | 108 | 109 | 109 | 79.7 | 24 | 110 | 91 | 20 | 102 |
| Outlook | -11 | -6 | -4 | -3 | 35.5 | 75 | 9 | -22 | 31 | -2 |
| Sales | ||||||||||
| Observed 3-Mos | 7 | 11 | 11 | 11 | 62.1 | 41 | 18 | -11 | 29 | 6 |
| Expected 3-Mos | 1 | 8 | 10 | 11 | 40.7 | 70 | 17 | -10 | 27 | 7 |
| Sales Price | ||||||||||
| Observed over 3-Mos | 3 | 5 | 5 | 4 | 77.8 | 7 | 5 | -4 | 9 | 0 |
| Expected over 3-Mos | 3 | 3 | 3 | 3 | 80.0 | 4 | 5 | -5 | 10 | 0 |
| Employment | ||||||||||
| Observed over 3-Mos | 12 | 11 | 17 | 14 | 82.1 | 9 | 17 | -11 | 28 | 5 |
| Expected over 3-Mos | 0 | 5 | 12 | 10 | 20.8 | 68 | 19 | -5 | 24 | 5 |
by Robert Brusca July 25, 2008

The German CPI ex-energy inflation rate is still very
well-behaved with inflation on that score below 2% over 12-months and
nearer to 1% over three- and six-months. For the PPI ex energy trends
are worsening, however. Export and import prices excluding the effects
of energy – just reported - are both up by over 2% over twelve months.
On shorter horizons where they are accelerating sharply, those trends
may be real but since the data are not seasonally adjusted those
calculations are not so reliable.
Still, what is disturbing about those trends is the clear
acceleration in the ex-petrol inflation rates over those less reliable
but shorter horizons.
On balance German inflation does not seem imperiled. But the
ECB caps overall EMU inflation, not German inflation and as one of the
more price-stable countries in the Zone Germany still posts a headline
CPI that is up by 3.3% and an ex-energy result that is up by 1.9%. The
ex-energy number falls below the ECB CPI cap rate, but the ECB does not
have any ceiling except for the full CPI number. Perhaps behind the
closed doors of the meeting room the ECB Council takes some solace in
ex-energy inflation being better behaved, but not in public.
More ominously, the export and import prices for Germany –
despite ongoing euro strength- suggest that more inflation pressures
may be leaking in apart from energy. All in all this is not a great
result for the month, although the report has its spots for those who
may wish to mount an argument of optimism. I suspect the ECB and the
usual band of inflation adverse German observers will see little good
in this report.
| German International and Domestic Inflation Trends | |||||||
|---|---|---|---|---|---|---|---|
| % m/m | % Saar | ||||||
| SA: | Jun-08 | May-08 | Apr-08 | 3-Mo | 6-Mo | 12-Mo | Yr-Ago |
| Export Prices | 0.7% | 0.4% | 0.1% | 4.9% | 4.7% | 2.7% | 2.0% |
| Import Prices | 2.1% | 2.3% | 0.4% | 20.6% | 13.6% | 8.8% | 1.4% |
| NSA | |||||||
| Exports excl-Petroleum | 0.5% | 0.3% | 0.1% | 3.4% | 4.6% | 2.3% | 2.0% |
| Imports excl-Petroleum | 0.5% | 0.6% | 0.3% | 5.5% | 6.3% | 2.5% | 1.6% |
| Memo: SA | |||||||
| CPI | 0.4% | 0.5% | 0.0% | 3.4% | 3.1% | 3.3% | 2.0% |
| CPI excl Energy | 0.2% | 0.0% | 0.0% | 0.8% | 1.2% | 1.9% | 2.0% |
| PPI | 1.0% | 1.1% | 0.9% | 12.6% | 9.4% | 6.6% | 1.8% |
| PPI excl Energy | 0.4% | 0.4% | 0.2% | 3.6% | 4.2% | 2.9% | 2.8% |

Tom Moeller
AuthorMore in Author Profile »Prior to joining Haver Analytics in 2000, Mr. Moeller worked as the Economist at Chancellor Capital Management from 1985 to 1999. There, he developed comprehensive economic forecasts and interpreted economic data for equity and fixed income portfolio managers. Also at Chancellor, Mr. Moeller worked as an equity analyst and was responsible for researching and rating companies in the economically sensitive automobile and housing industries for investment in Chancellor’s equity portfolio. Prior to joining Chancellor, Mr. Moeller was an Economist at Citibank from 1979 to 1984. He also analyzed pricing behavior in the metals industry for the Council on Wage and Price Stability in Washington, D.C. In 1999, Mr. Moeller received the award for most accurate forecast from the Forecasters' Club of New York. From 1990 to 1992 he was President of the New York Association for Business Economists. Mr. Moeller earned an M.B.A. in Finance from Fordham University, where he graduated in 1987. He holds a Bachelor of Arts in Economics from George Washington University.
More Economy in Brief


