 Global| Aug 26 2003
U.S. Durable Goods Orders Rose Further
by:Tom Moeller
|in:Economy in Brief
Summary
Durable goods orders added another 1.0% in July to the upwardly revised 2.6% gain in June. The gain matched Consensus expectations for a 1.0% rise. A 5.5% jump for motor vehicles & parts powered the July orders gain. However, for the [...]
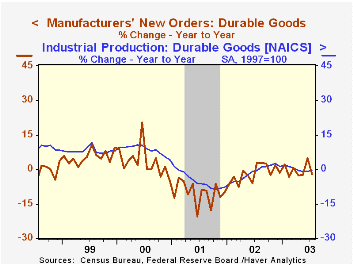
Durable goods orders added another 1.0% in July to the upwardly revised 2.6% gain in June. The gain matched Consensus expectations for a 1.0% rise.
A 5.5% jump for motor vehicles & parts powered the July orders gain. However, for the transportation sector as a whole orders fell 0.8% due to a 14.6% drop in aircraft orders which reversed a 10.9% jump in June. Excluding the transportation sector, durable orders rose 1.7% (1.7% y/y) following a little revised 1.5% gain in June.
Nondefense capital goods orders added 1.2% to the 3.8% June gain. Excluding aircraft and parts, nondefense capital goods orders rose 0.4% (5.0% y/y). That followed a 2.1% gain in June, revised up from 0.6% reported initially.
During the last nine years there has been an 86% correlation between the y/y change in nondefense capital goods orders and the change in nonresidential investment in equipment & software. There has been a 96% correlation between the change in shipments of these capital goods and investment.
Orders for computers & electronic products were robust for the fifth month this year, up 1.9% (9.3% y/y) in July. Orders for computers & related products surged 2.4% (24.3% y/y). Machinery orders advanced 1.8% (-2.1% y/y) for the second consecutive strong monthly gain.
Shipments of durable goods jumped 2.6% (-0.1% y/y) on top of an upwardly revised 1.7% gain in June. Durable goods shipments were up 4.9% YTD.
Durable inventories fell sharply again, last month down 0.9% (-3.2% y/y). Inventory decumulation was across the board.
| NAICS Classification | July | June | Y/Y | 2002 | 2001 | 2000 |
|---|---|---|---|---|---|---|
| Durable Goods Orders | 1.0% | 2.6% | -2.0% | -1.7% | -10.5% | 3.2% |
| Nondefense Capital Goods | 1.2% | 3.8% | 3.7% | -7.2% | -15.5% | 7.4% |
by Tom Moeller August 26, 2003
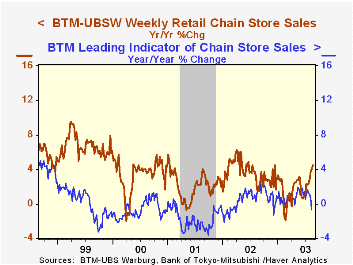
Chain store sales rose 0.2% last week according to the BTM-UBSW survey, partially recovering a 0.5% decline the week earlier.
The level of sales in August, with the just one week left to tally, is 0.9% above the July average. July sales rose 1.4% from June.
During the last five years there has been a 62% correlation between the year-to-year percent change in chain store sales and the change in nonauto retail sales less gasoline.
The BTM-UBSW retail chain-store sales index is constructed from the sales results reported by seven retailers: Dayton Hudson, Federated, Kmart, May, J.C. Penney, Sears and Wal-Mart.
| BTM-UBSW (SA, 1977=100) | 8/23/03 | 8/16/03 | Y/Y | 2002 | 2001 | 2000 |
|---|---|---|---|---|---|---|
| Total Weekly Retail Chain Store Sales | 426.9 | 426.2 | 4.5% | 3.6% | 2.1% | 3.4% |
by Tom Moeller August 26, 2003

Sales of new single family homes slipped 2.9% in July. That followed an 8.3% surge in June which was nearly double the initial estimated gain. July sales were the second highest on record at a 1.165M unit rate and slightly beat Consensus expectations for 1.150M.
In the Northeast, sales fell 20.8% (0.0% y/y) from a downwardly revised June level. In the West sales fell 16.3% (19.8% y/y) from a June level that was revised up.
Elsewhere sales rose last month. In the Midwest sales rose 17.3% (21.1% y/y) following an 18.1% June gain that was nearly doubled. Sales in the South rose 1.1% (24.9% y/y).
The median price of a new home rose to $191,500 (9.1% y/y). The prior month's figure was revised down slightly.
The new home sales data reflect current sales versus the existing home sale figures which reflect closings on past sales.
| Homes Sales (000s, AR) | July | June | Y/Y | 2002 | 2001 | 2000 |
|---|---|---|---|---|---|---|
| New Single-Family | 1,165 | 1,200 | 21.2% | 977 | 907 | 880 |
by Tom Moeller August 26, 2003

The Conference Board’s Index of Consumer Confidence in August gained back most of a moderate decline in July. The index rose 5.6% to 81.3 versus Consensus estimates for a reading of 80.0.
The rise in Confidence contrasted with the mid-month read of consumer sentiment from the University of Michigan which fell 0.8% versus July.
The August gain in Confidence reflected a 9.4% (-1.2% y/y) rise in the index of consumer expectations.Consumers' read of the present situation fell for the sixth month this year, down 2.2% (-33.8% y/y).
Consumers’ appraisal of current business conditions deteriorated as jobs were viewed as hard to get by 34.1% of respondents, the highest level in nearly 10 years. Despite this gloom consumers' plans for purchasing a home and major appliances improved. Plans to buy carpet or an automobile fell and have been trending lower.
The Conference Board’s survey is conducted by a mailed questionnaire to 5,000 households and about 3,500 typically respond.
| Conference Board | August | July | Y/Y | 2002 | 2001 | 2000 |
|---|---|---|---|---|---|---|
| Consumer Confidence | 81.3 | 77.0 | -14.0% | 96.6 | 106.6 | 139.0 |

Tom Moeller
AuthorMore in Author Profile »Prior to joining Haver Analytics in 2000, Mr. Moeller worked as the Economist at Chancellor Capital Management from 1985 to 1999. There, he developed comprehensive economic forecasts and interpreted economic data for equity and fixed income portfolio managers. Also at Chancellor, Mr. Moeller worked as an equity analyst and was responsible for researching and rating companies in the economically sensitive automobile and housing industries for investment in Chancellor’s equity portfolio. Prior to joining Chancellor, Mr. Moeller was an Economist at Citibank from 1979 to 1984. He also analyzed pricing behavior in the metals industry for the Council on Wage and Price Stability in Washington, D.C. In 1999, Mr. Moeller received the award for most accurate forecast from the Forecasters' Club of New York. From 1990 to 1992 he was President of the New York Association for Business Economists. Mr. Moeller earned an M.B.A. in Finance from Fordham University, where he graduated in 1987. He holds a Bachelor of Arts in Economics from George Washington University.
More Economy in Brief


