 Global| Apr 25 2007
U.S. Durable Goods Orders Rise by 3.4% in March
Summary
Durable goods orders are up by 3.4% after a rise of 2.4% in February. In most cases this sort of back-to-back gain would set a strong chain of growth in place. Instead, orders are still in a hole following a plunge of 8.8% in January. [...]
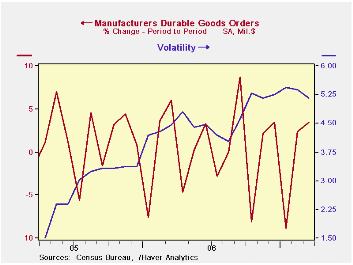
Durable goods orders are up by 3.4% after a rise of 2.4% in February. In most cases this sort of back-to-back gain would set a strong chain of growth in place. Instead, orders are still in a hole following a plunge of 8.8% in January. On balance the durable goods report shows some progress – better than expected progress -- after a very weak start in 2007. To be sure this month’s improvement does not wash out the weakness from earlier in the year. But it goes a long way to putting the MFG sector on firmer ground. Unfilled orders continue to look very strong in this report. One interesting feature of this report is the high degree of volatility it has showed. Volatility is up by 2 ½ times compared to early 2005 making it difficult to discern trend. Within the last seven months there have been THREE monthly changes in orders of 8% or more.
Three month trends are lower because in January orders were off by 8.8% and that is driving the last three month trend calculation. Next month that will fall out of the calculation and we have two quite firm months to add to whatever result April brings. On balance while we cannot say the current trends are good or solid, we can say that these lumpy data make us unsure of exactly which trend to trust. IF the data turn positive in April, we will be left with nice up trends instead of what we have now for three months.
Diffusion calculations that count the ups and downs of sector growth rates instead by overall weighted magnitudes of growth also show weakness. That’s over three months the weakness has not just been ‘severe’ but also broad-based.’ Three months shipments’ diffusion shows a value of 42 implying that over three months more sectors showed shipments decelerating compared to their six month behavior. Orders diffusion for three months was worse, too, at 28 showing orders increased in three months compared to six months in under 30% of the industries. But unfilled orders continue to mount up with 87% of the sectors showing that unfilled orders rose faster in three months than they did over six. Sales growth outpaced inventory growth in a small minority of sectors over three months. The weakness that the 8.8% drop in orders created seems to have permeated most measures and sectors for industry. Fortunately in the past two months MFG sectors show signs of breaking out of it.
The chart above plots the volatility of orders. It is quite clear that orders have had some voracious ups and downs. The past three months mimic a pattern from the previous three moths of showing a huge decline in orders followed by two quite robust monthly gains.
If we look at the major seven sectors (primary metals, fabricated metals, machinery, computers & electronics, electrical equipment, transportation equipment, and all other durables) we find that until six months ago the trends were declining and seemed to bottom. That is true of trends for both shipments and orders. But over the recent three months trends splayed in all directions, with most turning lower. Over the backward looking periods of three months, six months, and one year, order backlogs continue to show that they are rising and doing so fairly steadily. Work is piling up but increasingly it is not getting done. One singularly common feature is that these stepwise growth rates show across almost all sectors that inventory growth has been slowing. The sole exception is primary metals where prices have begun to flare once again. For computers & electronics, as well as for electrical equipment, stocks of inventories have actually been reduced.
It seems that inventory liquidation is in progress or at least that balance is being restored. After the sharp drop in orders, the desire to control stocks is understandable. We continue to see MFG as a sector that has undergone adjustment.
The MFG surveys for April (so far) continue to be uneven. It is not clear when they will light up MFG output again. For now it is a curiosity that the consumer has held up but that US business investment has been so lean. US investment and capital goods weakness is particularly surprising with the release of new German GDP data today and all the commentary there about how capital goods investment is driving German growth. Especially with the euro at these levels how could German firms benefit so much and US firms so little? What are US firms doing so badly that they are getting none of this business and investing nothing (or less) at home to boot?
| Durable Goods | 1Mo:m/m | 3Mo | 6Mo | 9Mo | 12Mo | Year Ago |
| Shipments | 0.8% | -8.1% | -0.9% | -3.2% | -0.6% | 7.6% |
| New Orders | 3.4% | -13.1% | -12.0% | -1.1% | -2.1% | 17.5% |
| Unfilled Orders | 1.8% | 13.6% | 18.6% | 20.9% | 19.8% | 20.9% |
| Inventories | 0.3% | 3.2% | 5.0% | 7.4% | 8.4% | 2.1% |
| I:S Ratio | 143.8% | 139.6% | 139.7% | 133.0% | 131.9% | 138.9% |
| Excl Transportation | 1Mo:m/m | 3Mo | 6Mo | 9Mo | 12Mo | Year Ago |
| Shipments | 0.3% | -3.7% | -2.5% | -3.0% | 0.1% | 8.4% |
| New Orders | 1.5% | -8.7% | -3.6% | -3.6% | -0.5% | 10.5% |
| Unfilled Orders | 0.9% | 10.1% | 11.5% | 12.2% | 13.5% | 12.8% |
| Inventories | 0.1% | 1.6% | 4.3% | 7.5% | 8.3% | 2.9% |
| I:S Ratio | 150.2% | 148.2% | 145.2% | 139.1% | 138.8% | 146.3% |
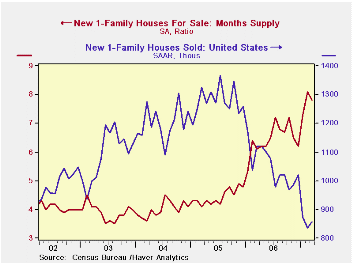 New home sales take a breather in March but still ride a strong and unrelenting DOWN-trend. New home sales continue to plunge despite the tiny bounce in sales in March. The number of homes for sale has surged in terms of the number of months of supply. That has worsened in part because of the slower selling pace. By comparison, existing home sales are doing a lot better with the stock of homes there contracting and the pace of sales decline muted. For new home sales - even the regional data - by and large- show that the pace is WORSENING. New home sales take a breather in March but still ride a strong and unrelenting DOWN-trend. New home sales continue to plunge despite the tiny bounce in sales in March. The number of homes for sale has surged in terms of the number of months of supply. That has worsened in part because of the slower selling pace. By comparison, existing home sales are doing a lot better with the stock of homes there contracting and the pace of sales decline muted. For new home sales - even the regional data - by and large- show that the pace is WORSENING.We might even be persuaded to call the pace of decline catastrophic if it were not for one thing: That is that home prices are rising in the month and are up solidly Y/Y. Median prices are up by 6.4% Y/Y and average prices are up a staggering 10.4% Y/Y. What? YES! Do prices tell us a different story or lie? This is partly because prices in March a year ago fell sharply. If we re-cast the Y/Y calculation to take the average of February and April prices as the base for the Y/Y calculations (skipping March and effectively interpolating a different number) median prices are flat but average home prices still rise by 7.1%. This is evidence that the worst of it is in the moderately priced homes, although we know that the earning of high end builders are being hit as well. Builders appear to be using their capital to support prices or cut deals where they do not show up in the data as price declines. This sort of tool is more likely available for enticing high-end home-buyers with houses filled with lots of goodies than for low end home buyers where the new buyer wants most of all a house at the lowest price possible.The regional data show us that the pace of the sales decline is not slowing except in the Northeast (NE) where the winter months sales are always suspect. They are more suspect since the NE is the only region to show Y/Y gains is new home sales… Across the rest of the country, annual regional declines are on the order of 20% to 30%. The recent three month growth rates for new home sales in those remaining three regions range from minus 50 percent to minus 107 percent. So while this is a weak report and it will feed weakness into GDP it is also is a report where the housing sector appears to be somewhat at least in strong hands; hands that are able to control prices and keep them from spiraling lower in the face of a very weak pace of sales. This phenomenon will be very interesting to watch in the coming months. |
| Momentum: Annualized Rates of Change | Prices | ||||||
| As of: | Total | North East | Mid West | South | West | Median | Average |
| Mar.07 | Month-to-month percent change | ||||||
| Mar.07 | 2.6% | 50.0% | 9.8% | -2.7% | -0.9% | 0.9% | 1.5% |
| Feb.07 | -4.2% | -21.3% | -22.8% | -5.7% | 21.8% | 1.0% | 4.7% |
| Jan.07 | -14.4% | -16.4% | -13.7% | -8.1% | -27.5% | 1.9% | 3.2% |
| Annualized Rates | |||||||
| Total | North East | Mid West | South | West | Median | Average | |
| 3-Mo | -63.5% | -5.5% | -107.1% | -62.7% | -50.2% | 16.1% | 44.3% |
| 6-Mo | -32.1% | 32.3% | -8.6% | -45.7% | -30.6% | 25.5% | 24.8% |
| 1-Yr | -23.5% | 18.0% | -19.3% | -25.7% | -29.6% | 6.4% | 10.7% |
by Robert Brusca April 25, 2007
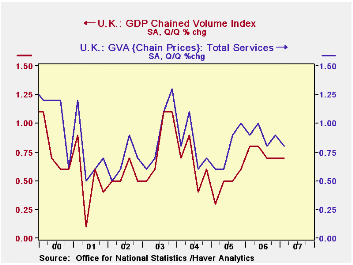
GDP expanded 0.7% in the UK in Q1 2007, the same as in Q4 and a bit better than forecasters' estimate of 0.6%. The year-on-year gain was 2.8%. At first glance, the most notable aspect of this Office for National Statistics "preliminary" GDP report is a decline in manufacturing. That sector's value added declined by 0.3% from Q4. It was up just 1.4% from a year ago. However, this is not seen as a sign of weakness; most segments of this sector, according to ONS's "Briefing Notes" held basically flat.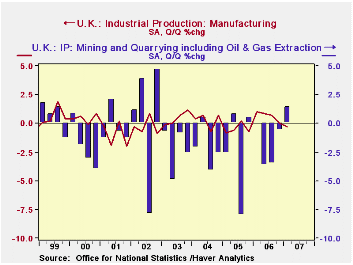
The main story in the UK data, at least for this quarter, is the upturn in the mining sector. The opening of the new Buzzard oil field in the North Sea yielded a 1.4% quarterly advance in the mining sector following almost five years of decline. Utility output also gained 1.4%. The services sector remained the mainstay of growth, up 0.8% and 3.5% year-to-year. Transportation and business services both had expansions of more than 1%.
The other main economy to publish Q1 GDP today is South Korea. Its growth was 0.9%, also the same as in Q4, with 3.9% growth year-on-year. Unexpectedly for an Asian country, manufacturing output declined here as well, by 0.8%. Consumer electronics and 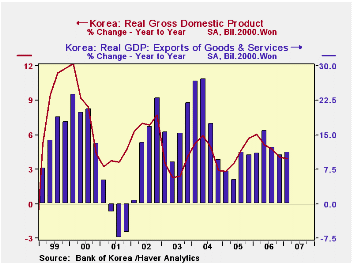 electrical equipment were the main sources of the decrease, according to industrial production data through February. Again, as with the UK, analysts seem unconcerned. Korea publishes its entire array of GDP, including the expenditure side, in this initial quarterly report, and observers took note of a good gain in exports, up 3.2%, following just 0.5% in Q4. In volume terms, exports constitute almost 60% of Korea's total GDP. So the implication is that, in the absence of evidence of a demand slowdown in China or the US, Korea's manufacturing sector can remain in an overall expansion, if not every single quarter.
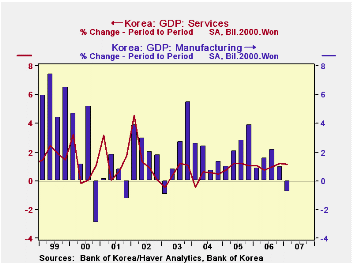
The Korean services sector is also expanding. It grew 1.2% in Q1, also duplicating the Q4 gain. Transportation, finance and health care had the biggest increases. Among other demand components, household consumption gained 1.3%, and capital investment was up 2.0%, mostly in equipment.
| GDP (SA, % Chg) | Q1 2007 | Q4 2006 | Q3 2006 | Year/Year | 2006 | 2005 | 2004 |
|---|---|---|---|---|---|---|---|
| UK Total | 0.7 | 0.7 | 0.7 | 2.8 | 2.8 | 2.0 | 3.2 |
| ex Oil & Gas | 0.7 | 0.7 | 0.6 | 3.0 | 2.9 | 2.2 | 3.5 |
| Mining | 1.4 | -0.6 | -3.5 | -6.3 | -7.9 | -9.5 | -7.9 |
| Manufacturing | -0.3 | 0.1 | 0.7 | 1.4 | 1.5 | -1.0 | 2.0 |
| Services | 0.8 | 0.9 | 0.8 | 3.5 | 3.6 | 2.9 | 3.9 |
| South Korea | 0.9 | 0.9 | 1.2 | 3.9 | 5.0 | 4.2 | 4.7 |
| Manufacturing | -0.8 | 1.0 | 2.2 | 4.0 | 8.4 | 7.1 | 11.1 |
| Services | 1.2 | 1.2 | 0.9 | 4.1 | 4.2 | 3.4 | 1.9 |

Robert Brusca
AuthorMore in Author Profile »Robert A. Brusca is Chief Economist of Fact and Opinion Economics, a consulting firm he founded in Manhattan. He has been an economist on Wall Street for over 25 years. He has visited central banking and large institutional clients in over 30 countries in his career as an economist. Mr. Brusca was a Divisional Research Chief at the Federal Reserve Bank of NY (Chief of the International Financial markets Division), a Fed Watcher at Irving Trust and Chief Economist at Nikko Securities International. He is widely quoted and appears in various media. Mr. Brusca holds an MA and Ph.D. in economics from Michigan State University and a BA in Economics from the University of Michigan. His research pursues his strong interests in non aligned policy economics as well as international economics. FAO Economics’ research targets investors to assist them in making better investment decisions in stocks, bonds and in a variety of international assets. The company does not manage money and has no conflicts in giving economic advice.
More Economy in Brief


