 Global| Jul 26 2007
U.S. Durable Goods Orders Missed Forecasts
by:Tom Moeller
|in:Economy in Brief
Summary
The 1.4% rise in new orders for durable goods during June missed Consensus expectations for a 1.6% increase. Though the shortfall was only slight, the gain failed to make up for a 2.3% decline during May and other details within the [...]
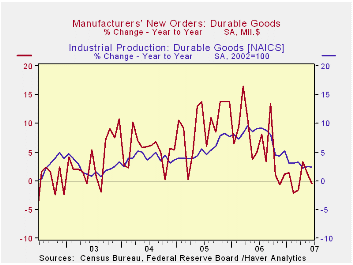
The 1.4% rise in new orders for durable goods during June missed Consensus expectations for a 1.6% increase. Though the shortfall was only slight, the gain failed to make up for a 2.3% decline during May and other details within the report were soft.
During the last ten years there has been a 67% correlation between the y/y change in durable goods orders and the change in production of durable goods.
Orders for nondefense capital goods did jump 4.6% last month, but again the increase failed to make up the prior month’s 6.8% decline. And excluding aircraft & parts orders fell 0.7%, the fourth decline this year and it pulled the y/y change to a negative 2.4%. During the last ten years there has been an 84% correlation between the y/y change in capital goods orders less aircraft and the y/y change in business fixed investment in equipment & software from the GDP accounts.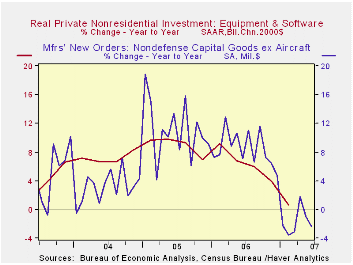
Orders for computers & electronic products fell 4.6% (-3.2% y/y) after a 5.0% gain during May. Orders for just computers & related products fell 3.9% (-2.2% y/y). Primary metals orders dropped 3.6% (-3.3% y/y) after a 4.7% slide during May. And the 1.5% (2.8% y/y) increase in electrical equipment orders during June only recouped about half of the prior month’s 3.8% slip.
Shipments of durable goods fell 1.1% (-0.8% y/y) after a modest 0.6% increase during May. Less the transportation sector shipments fell 1.1% (-0.2% y/y). During the last ten years there has been an 82% correlation between the y/y change in durable goods shipments and the change in industrial production of durable goods. The June decline reflected a 4.0% (-1.3% y/y) drop in shipments of computers & electronic products but a firm 0.7% (15.9% y/y) rise in shipments of machinery.
| NAICS Classification | June | May | Y/Y | 2006 | 2005 | 2004 |
|---|---|---|---|---|---|---|
| Durable Goods Orders | 1.4% | -2.3% | -0.6% | 6.3% | 9.9% | 5.3% |
| Excluding Transportation | -0.5% | -0.2% | -1.7% | 7.6% | 8.8% | 7.9% |
| Nondefense Capital Goods | 4.6% | -6.8% | 6.5% | 10.6% | 17.1% | 5.7% |
| Excluding Aircraft | -0.7% | -1.5% | -2.4% | 8.5% | 11.1% | 3.2% |
by Tom Moeller U.S. Jobless Insurance Claims Fell Again July 26, 2007
Initial unemployment insurance claims fell another 2,000 last week to 301,000 after a revised and lessened 6,000 decline during the prior week to the lowest level since May.
During the last ten years there has been a (negative) 78% correlation between the level of initial claims and the m/m change in nonfarm payroll employment.
The four-week moving average of initial claims fell to 308,500 (-1.4% y/y).
Continuing claims for unemployment insurance fell 19,000 after a very much revised 13,000 increase during the prior week.
The insured rate of unemployment was stable at 1.9%. 
| Unemployment Insurance (000s) | 07/14/07 | 07/12/07 | Y/Y | 2006 |
|---|---|---|---|---|
| Initial Claims | 301 | 303 | -0.3% | 313 |
| Continuing Claims | -- | 2,545 | 3.3% | 2,459 |
by Tom Moeller July 26, 2007

 The inventory of unsold homes was unchanged for the month and actually fell 5.0% y/y.
The median new home price fell 1.3% (-2.2% y/y) for the month.
The inventory of unsold homes was unchanged for the month and actually fell 5.0% y/y.
The median new home price fell 1.3% (-2.2% y/y) for the month.
The Fed’s latest Beige Book covering regional economic activity is available here.
| US New Homes | June | May | Y/Y | 2006 | 2005 | 2004 |
|---|---|---|---|---|---|---|
| Total Sales (SAAR, 000s) | 834 | 893 | -22.3% | 1,049 | 1,279 | 1,201 |
| Median Price (NSA, $) | 239,800 | 239,400 | -2.1% | 241,125 | 234,208 | 217,817 |
by Robert Brusca July 25, 2007
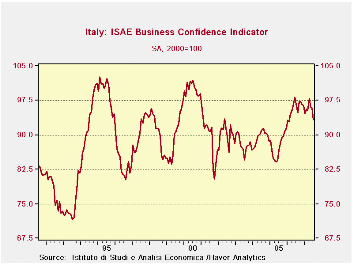
Business confidence in Italy is still at a reasonably strong reading. The index fell this month to 93.3 from 95.9. The month’s drop is relatively sharp. The chart pattern for the index is much more ominous than for most EMU members. Italy has been the weakest of the large EMU countries for some time. We maintain that the place to look for vulnerability to the strong euro value is not in the EMU’s strongest economy, Germany, but in some of its weaker members. Italy is a case in point.
Percentile readings of the ISAE survey components are mostly in the 60 to 70 percentile range. But residing in the 61.4 percentile of their range, foreign orders are one of the weaker categories. This is a reading that would be expected to get weak if Italy developed competitiveness problems. Consumer goods reading are among the weakest by industry group with percentile readings that fall out of the 60th percentile in the 50s. But the loss in momentum is greater for investment goods than for consumer goods even though the consumer goods raw readings are weaker in absolute terms.
On balance, Italy appears to have lost a lot of momentum. Its readings are reassuring and are nonetheless still solid. We would start to get more worried about Italy and the hint of the loss in competitiveness if the drop in the index we see this month extends itself in the coming months. For now, it is just a warning and possibly a bit of mid-summer volatility...but also possibly something more.
| Since January 1999 | 4COLSPAN | |||||||||
| Jul-07 | Jun-07 | May-07 | Apr-07 | Percentile | Rank | Max | Min | Range | Mean | |
| Biz Confidence | 93.3 | 95.9 | 96 | 97.9 | 60.3 | 35 | 102 | 80 | 21 | 92 |
| TOTAL INDUSTRY | ||||||||||
| Order books & Demand | ||||||||||
| Total | -3 | 2 | 2 | 3 | 60.0 | 29 | 13 | -27 | 40 | -10 |
| Domestic | -2 | 0 | 0 | 2 | 68.3 | 17 | 11 | -30 | 41 | -12 |
| Foreign | -6 | -1 | 1 | -3 | 61.4 | 32 | 11 | -33 | 44 | -14 |
| Inventories | 8 | 5 | 5 | 5 | 79.2 | 20 | 13 | -11 | 24 | 4 |
| Production | 7 | 9 | 6 | 5 | 69.4 | 11 | 22 | -27 | 49 | -6 |
| INTERMEDIATE | ||||||||||
| Order books & Demand | ||||||||||
| Total | 0 | 2 | 3 | 5 | 65.5 | 23 | 19 | -36 | 55 | -11 |
| Domestic | -3 | -1 | 1 | 4 | 60.4 | 20 | 16 | -32 | 48 | -13 |
| Foreign | -1 | 1 | 3 | -2 | 67.2 | 22 | 18 | -40 | 58 | -12 |
| Inventories | 7 | 5 | 2 | 4 | 75.9 | 12 | 14 | -15 | 29 | 0 |
| Production | 4 | 6 | 8 | 9 | 60.3 | 19 | 27 | -31 | 58 | -7 |
| INVESTMENT GOODS | ||||||||||
| Order books & Demand | ||||||||||
| Total | 12 | 19 | 17 | 20 | 70.1 | 16 | 32 | -35 | 67 | -6 |
| Domestic | 5 | 9 | 10 | 13 | 66.1 | 16 | 25 | -34 | 59 | -11 |
| Foreign | 3 | 8 | 13 | 9 | 64.3 | 26 | 23 | -33 | 56 | -8 |
| Inventories | 9 | 9 | 7 | 6 | 70.3 | 15 | 20 | -17 | 37 | 1 |
| Production | 20 | 23 | 18 | 12 | 77.3 | 11 | 35 | -31 | 66 | -2 |
| CONSUMER GOODS | ||||||||||
| Order books & Demand | ||||||||||
| Total | -4 | -2 | -5 | -8 | 56.8 | 24 | 15 | -29 | 44 | -10 |
| Domestic | -7 | -6 | -10 | -10 | 58.3 | 35 | 8 | -28 | 36 | -12 |
| Foreign | -7 | -7 | -6 | -12 | 59.6 | 20 | 12 | -35 | 47 | -15 |
| Inventories | 9 | 7 | 11 | 7 | 76.9 | 17 | 15 | -11 | 26 | 4 |
| Production | 3 | 2 | -5 | -5 | 77.8 | 10 | 11 | -25 | 36 | -7 |
| Total number of months: | 100 | 6COLSPAN | ||||||||
by Carol Stone July 26, 2007

Statistics Canada today reported monthly data on payroll employment for May, its establishment employment survey. The total number of employees increased 6,900, roughly in line with the experience over the previous months of 2007, which averaged 8,500.
An industrial breakdown shows firmer gains, though, in both goods-producing and services-producing sectors. Goods industries saw jobs increase 18,600 and services, 27,700. The difference between the sum of the individual sectors and the total comes in a group of "unclassified enterprises". Reported employment in these firms dropped sharply in May, by 37,600 before seasonal adjustment. This is out of line with its prior behavior, and we wonder if it might be revised in a month's time or so.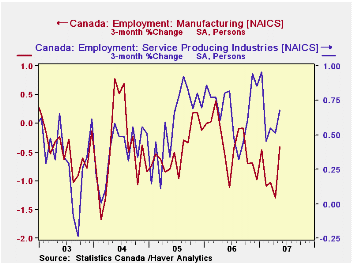
Meantime, there were constructive increases in the individual sectors. The goods industries had contracted in February, March and April by a total of more than 26,000. Most of this was in manufacturing, but jobs in forestry & logging, mining and utilities also fell. May saw further and bigger declines in mining, but forestry turned sharply higher and manufacturing increased by 7,900, the strongest monthly performance since September 2004. Both durable and nondurable goods segments participated. Construction jobs have seen persistent and significant growth, running 5.5% over the last 12 months and 6.1% during 2006.
Among service industries, there was quite a mix. Finance and professional & technical services showed good gains and transportation, retailing and accommodations & food services were all relatively strong. Areas of modest growth or outright decline included real estate, business services and administrative support. Public administration and public service sectors such as health care and education were also on the slow side.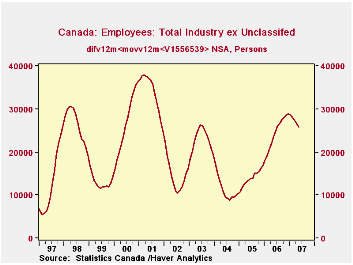
As with many kinds of economic data, Canada's payroll employment shows mixed behavior among the components and varying movement over time. The new DLXVG3, coming out soon, will assist in the assessment of such data. In the last chart here, we show the total series excluding the unclassified enterprises. To try to diminish some of the "noise" in the monthly changes, we can calculate some trends. We start by taking a 12-month moving average in the data and then we take the average monthly change over 12-month periods. This is seen in the last graph. It is evident that job growth is much steadier now than it was in the earlier history of this survey. From early 1997 to mid-2004, a period of 90 months, there were three distinct cycles of strength and weakness in industry jobs, lasting an average of 30 months or 2-1/2 years. In the 3 years since, there has been only a bit more than half a cycle, with the uptrend showing more gradual improvement than before, but obviously lasting much longer. Over the first 5 months of this year, industry employment growth appears to be slowing, but again more gradually than in the previous cycles. It will be interesting to see way the pattern evolves in coming months.
| CANADA, Thous. | May 2007* | Apr 2007* | Dec 2006* | Year Ago | 2006 | 2005 | 2004 |
|---|---|---|---|---|---|---|---|
| Total Employees (incl Unclassified) |
14,259 | 14,252 | 14,218 | 14,019 | 14,041 | 13,702 | 13,440 |
| Average Monthly Changes | 7 | 1 | 8 (Dec to May) | 21 | 29 | 22 | 16 |
| % Change | 0.0% | 0.0% | 0.1% | 1.7% | 2.5% | 2.0% | 1.5% |
| Total ex Unclassified** | 38 | 9 | 19 | 1.9% | 2.6% | 1.5% | 0.9% |
| Goods Producing** | 19 | -12 | 0 | -0.1% | 1.4% | 0.1% | 0.0% |
| Construction** | 12 | 3 | 4 | 5.5% | 6.1% | 4.7% | 4.5% |
| Manufacturing** | 8 | -4 | -3 | -2.3% | -1.0% | -1.9% | -2.1% |
| Service Producing** | 28 | 12 | 20 | 2.4% | 2.9% | 1.9% | 1.2% |
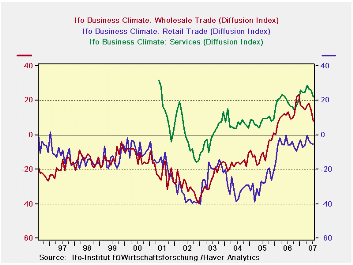
| · All main sectors in Germany are showing a loss in momentum in July…· Germany’s services sector has sharply tailed off in July as all sectors except construction ease in July. Construction and retail remain as the main lagging sectors with readings in each of these sectors in more moderate positions of the historic ranges. The overall and MFG pictures still show readings in the 90th range percentiles. The services sector is in the 85th percentile; wholesaling is in the 75th percentile. In short the IFO survey shows some but small and creeping erosion in Germany. We may be better able to pin it out when the IFO provides the details in about a week’s time. For now the weakness in the service sector is leading the drop off an erosion that does not help us to name the culprit doing the damage to the outlook or to current conditions. |
|---|
  |
| Current | Last Mo | Since Jan 1991* | ||||||
| Jul-07 | Jun-07 | average | Median | Max | Min | range | % range | |
| All Sectors | 12.0 | 13.2 | -8.8 | -9.5 | 16.6 | -30.6 | 47.2 | 90.3% |
| MFG | 23.5 | 23.9 | -1.1 | 0.3 | 27.5 | -35.5 | 63.0 | 93.7% |
| Construction | -15.3 | -16.1 | -29.3 | -32.2 | 0.3 | -50.7 | 51.0 | 69.4% |
| Wholesale | 8.1 | 14.2 | -14.8 | -16.5 | 23.3 | -39.6 | 62.9 | 75.8% |
| Retail | -5.4 | -5.0 | -14.9 | -14.8 | 21.2 | -40.2 | 61.4 | 56.7% |
| Services | 22.0 | 26.0 | 8.3 | 7.8 | 28.5 | -15.7 | 44.2 | 85.3% |
| * May 2001 for Services | ||||||||

Tom Moeller
AuthorMore in Author Profile »Prior to joining Haver Analytics in 2000, Mr. Moeller worked as the Economist at Chancellor Capital Management from 1985 to 1999. There, he developed comprehensive economic forecasts and interpreted economic data for equity and fixed income portfolio managers. Also at Chancellor, Mr. Moeller worked as an equity analyst and was responsible for researching and rating companies in the economically sensitive automobile and housing industries for investment in Chancellor’s equity portfolio. Prior to joining Chancellor, Mr. Moeller was an Economist at Citibank from 1979 to 1984. He also analyzed pricing behavior in the metals industry for the Council on Wage and Price Stability in Washington, D.C. In 1999, Mr. Moeller received the award for most accurate forecast from the Forecasters' Club of New York. From 1990 to 1992 he was President of the New York Association for Business Economists. Mr. Moeller earned an M.B.A. in Finance from Fordham University, where he graduated in 1987. He holds a Bachelor of Arts in Economics from George Washington University.
More Economy in Brief


