 Global| Aug 26 2009
U.S. Durable Goods Orders Look To Form Base for Recovery
Summary
Durable goods orders rebounded in July, jumping 4.9%, and June's numbers were revised higher so that the original 2.5% decline is now shown at 1.3%. The major part of the July gain was in nondefense aircraft orders, which more than [...]

Durable goods orders rebounded in July, jumping 4.9%, and June's numbers were revised higher so that the original 2.5% decline is now shown at 1.3%. The major part of the July gain was in nondefense aircraft orders, which more than doubled from their June amount. However, other orders also increased by a total of 1.9%; this subtotal had been virtually flat in May and June.
Most industry groups in this advance report saw orders increase in July, and some sectors that were weak in June saw notable upward revisions. In particular, the computer and communications sectors, which had been mainly responsible for the original June contraction now appear to be performing much better. Computer orders were changed from -1.2% in June to +0.5%, while they did drop back in the July data by 2.8%. Communications equipment, initially with a major decline of 10.8% in June, experienced a revision to just -0.6%, and surged by 9.4% last month.
Among other sectors, only machinery orders fell in July, by 6.6%. By contrast, electrical equipment and appliance orders gained 5.3% and primary metals and fabricated metal products had increases of 2.6% and 2.8%, respectively. "Other" durable goods orders were up 2.4%.
By end-use, orders for nondefense capital goods rose 8.6%, but
this was fully accounted for by the big aircraft gain. Other capital
goods orders eased by 0.3%.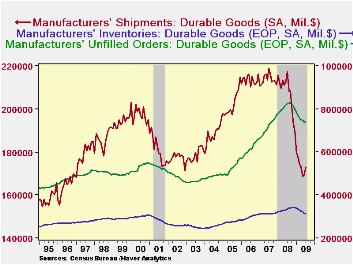
In last month's commentary on this report, Tom Moeller bemoaned the fact that durable goods shipments were continuing to languish. That may be starting to change. The marginal decline for June reported then is now estimated at +0.7%, with July following with a 2% increase. Computers, semiconductors, motor vehicles and aircraft led the upturn, and several other items also gained. Inventories, however, continue to decline, although the 0.8% July fall is noticeably less than 1.3% average over the first half of 2009. Another still-hesitant indicator is unfilled orders; these edged down 0.1% in July, following nine consecutive declines averaging 1.2%. Thus, the durable goods industries seem to be preparing to break out of their recession. However, those sizable revisions to June's advance data suggest that some skepticism remains in order.
The durable goods figures are available in Haver's USECON database.
| NAICS Classification (%) | July | June | May | Y/Y | 2008 | 2007 | 2006 |
|---|---|---|---|---|---|---|---|
| Durable Goods Orders | 4.9 | 1.3 | -22.8 | -5.8 | 1.4 | 6.2 | |
| Excluding Transportation | 0.8 | |
0.8 | -22.5 | -1.2 | -0.3 | 9.1 |
| Nondefense Capital Goods | 8.6 | 9.1 | -22.9 | -6.8 | 3.5 | 9.4 | |
| Excluding Aircraft | -0.3 | 4.3 | -21.6 | -0.3 | -2.7 | 10.7 |
by Carol Stone August 26, 2009
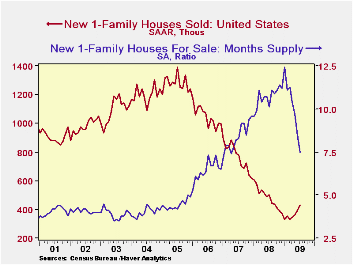
Sales of new single-family homes rose again in July, the fourth consecutive monthly gain. The seasonally adjusted annual rate was 433,000, up 9.6% from an upwardly revised 395,000 in June and the largest monthly amount since September 2008. Sales were 13.4% below the year earlier amount; while still a sizable shrinkage, this compares very well with the worst of these year-to-year comparisons, 45.9% as recently as January. In fact, it is the most favorable yearly comparison ("least unfavorable", is perhaps better) since April 2006.
The latest sales increase is more encouraging than the previous month's because it was accompanied by almost steady prices. The median price was $210,100 compared to $210,400 in June. More, the June number was revised up from $206,200. Further price encouragement comes from yesterday's report of the S&P Case Shiller Index for June. That widely watched measure of existing home prices rose 0.7%, its first positive monthly move since May 2006.*
Sales volume advanced in three of the four regions. The
Northeast led with a 16.2% gain, month-on-month. For July, its sales
ran 9.8% AHEAD of July 2008, the first yearly rise since October 2007.
Sales in the South increased 16.2% from upwardly revised amounts in
June and May. And volume in the West increased 1.0% from mildly revised
figures in the prior months. In contrast, some of the recent gain in
the Midwest was revised away and sales there fell 7.6% in July. So the
pattern is still quite uneven around the country. And the actual
numbers remain very small Still, they're mostly headed in a good
direction.
The market's aggregate condition continues to improve, as the overhang of unsold homes continues to fall. The decline in July was 3.2%; in conjunction with the sales gain, this put the months' supply of unsold homes at 7.5 months, down an entire month from June's figure and well off the 12.4 months registered in January.*Note there are two distinctions in these price series. The median price of new homes included in this dataset is simply that, the median price of the houses actually sold during the period, regardless of their characteristics. The Case-Shiller Index, firstly, pertains to existing homes, but secondly, it measures the price movements in the exact houses since the last time they were sold. So the weighted average price change that makes the index covers only price change with quality held constant. Both measures are valid, but they explain different kinds of price developments.
| US New Homes | July | June | May | Y/Y | 2008 | 2007 | 2006 |
|---|---|---|---|---|---|---|---|
| Total Sales (SAAR, 000s) | 433 | 395 | 362 | -13.4% | 479 | 768 | 1,049 |
| Northeast | 45 | 34 | 25 | +9.8 | 35 | 64 | 64 |
| Midwest | 61 | 66 | 48 | -4.7 | 69 | 118 | 161 |
| South | 222 | 191 | 202 | -18.4 | 264 | 408 | 559 |
| West | 105 | 104 | 87 | -14.6 | 111 | 178 | 266 |
| Median Price (NSA, $) | 210,100 | 210,400 | 221,400 | -11.5 | 230,408 | 243,742 | 243,067 |
| S&P Case-Shiller House Price Index (January 1980=100) | N.A. | 141.31 | 140.26 | -15.5 | 165.95 | 196.98 | 204.84 |
by Robert Brusca August 26, 2009
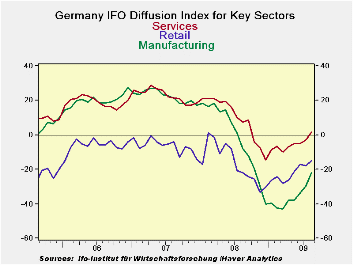
The month-to-month improvement in the all sector IFO diffusion
index is the second largest since 1991. All sectors improved in the
month. The manufacturing index is improving especially rapidly. The
services sector has dug itself out of its declining phase and has
posted not just an improvement but an outright gain in the month.
Still in relative terms, ranking sectors within each one’s
range of actual variation finds construction as the relative strongest
reading. Its -24 reading in August is above the mid point of its range
and just below its average reading of -29 compared to a current reading
of -24.
Retailing stands in the 44th percentile of its range.
Wholesaling and services stand in the upper thirty percentiles of their
respective ranges. While manufacturing is rising strongly it remains as
the relative weakest sector in the bottom 29th percentile of its range.
The overall index stands at the 30th percentile of its range.
The strong rise in the MFG sector drove the improvement this
month. as the MFG sector showed the greatest rise in the history of its
index. Wholesale’s improvement ranks eighth. The improvement in
services is the ninth largest in its shorter history since June 2001;
the other series date from 1991.
The rebound in the IFO index is impressive. The levels of the
various sectors fall short of being construed as a complete recovery,
but they do show that a recovery process is in train. It is too soon to
be able to guess accurately at when the economy will be on an even
keel. But for now the improvement is rapid and in the right direction.
The IFO confirms other reports that suggest that the recovery phase has
begun.
| Summary of IFO Sector Diffusion readings: CLIMATE | ||||||||
|---|---|---|---|---|---|---|---|---|
| CLIMATE Sum | Current | Last Month | Since Jan 1991* | |||||
| Aug-09 | Jul-09 | Average | Median | Max | Min | Range | % range | |
| All Sectors | -19.7 | -25.9 | -9.4 | -9.9 | 17.5 | -36.2 | 53.7 | 30.7% |
| MFG | -22.0 | -29.7 | -2.0 | -0.3 | 27.5 | -42.8 | 70.3 | 29.6% |
| Construction | -24.0 | -25.3 | -29.3 | -30.3 | 0.7 | -50.1 | 50.8 | 51.4% |
| Wholesale | -14.6 | -22.5 | -14.7 | -16.3 | 23.9 | -39.0 | 62.9 | 38.8% |
| Retail | -15.0 | -17.8 | -16.0 | -15.1 | 16.8 | -40.4 | 57.2 | 44.4% |
| Services | 1.4 | -3.0 | 10.9 | 9.5 | 28.5 | -14.5 | 43.0 | 37.0% |
| * June 2001 for Services | ||||||||
Carol Stone, CBE
AuthorMore in Author Profile »Carol Stone, CBE came to Haver Analytics in 2003 following more than 35 years as a financial market economist at major Wall Street financial institutions, most especially Merrill Lynch and Nomura Securities. She had broad experience in analysis and forecasting of flow-of-funds accounts, the federal budget and Federal Reserve operations. At Nomura Securities, among other duties, she developed various indicator forecasting tools and edited a daily global publication produced in London and New York for readers in Tokyo. At Haver Analytics, Carol was a member of the Research Department, aiding database managers with research and documentation efforts, as well as posting commentary on select economic reports. In addition, she conducted Ways-of-the-World, a blog on economic issues for an Episcopal-Church-affiliated website, The Geranium Farm. During her career, Carol served as an officer of the Money Marketeers and the Downtown Economists Club. She had a PhD from NYU's Stern School of Business. She lived in Brooklyn, New York, and had a weekend home on Long Island.
More Economy in Brief


