 Global| Sep 25 2009
U.S. Durable Goods Orders Decline Unexpectedly During August But Short-Term Trend Firms
by:Tom Moeller
|in:Economy in Brief
Summary
Durable goods orders declined unexpectedly last month and reversed half of the little-revised 4.8% jump during July. Virtually all of the August decline reflected lower orders for transportation equipment which gave back half of a [...]
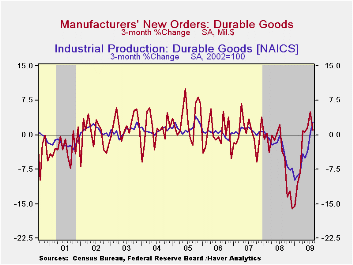
Durable goods orders declined unexpectedly last month and reversed half of the little-revised 4.8% jump during July. Virtually all of the August decline reflected lower orders for transportation equipment which gave back half of a strong gain during the month earlier. Excluding transportation equipment durable goods orders slipped 0.0% after a 0.9% July increase.
Despite the recent monthly volatility, a picture of moderate recovery has emerged from the factory sector. Overall durable goods orders have risen 3.3% since their January low. Moreover, orders excluding transportation equipment since their April low are up 4.4%. These increases have given rise to two months of firm gains in factory sector industrial output of 1.4% and 0.6%.
Lower bookings for transportation equipment reversed half of a
July increase with a 9.3% decline. A 29.9% (-21.4% y/y) drop in
aircraft orders was to blame. Orders for motor vehicles & parts
ticked up 0.4% (-23.3% y/y).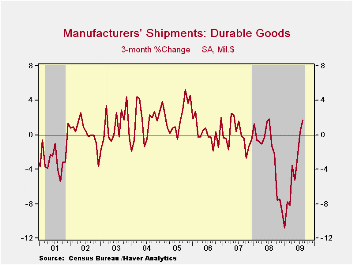
Only modest easing of orders in other industry groups was evident in last month's figures. New orders for computers and electronic products slipped 0.7% (-8.1% y/y) after three consecutive months of strong increase. Computer orders fell significantly for the second straight month (-9.6% y/y) but communications equipment orders increased for the second month (-11.8% y/y). Among other sectors machinery orders ticked up 0.7% (-29.3% y/y) after a hard 7.9% July decline while electrical equipment & appliance orders slipped 0.5% (-18.7% y/y) after a firm July gain. Primary metals posted a firm increase for the third consecutive month but remained off by one-third from the year ago level and fabricated metal products increased for the third straight month (-15.2% y/y).
New orders for nondefense capital goods fell a hard 7.1% and
reversed all of their July increase as aircraft orders fell. Other
capital goods orders slipped just 0.4% but they have risen by 6.5%
since their April low.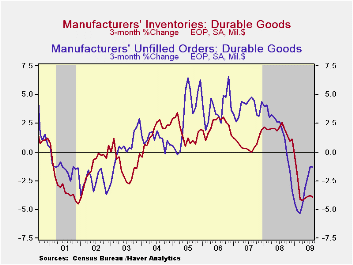
Whatever firming there has been in durable goods orders has yet to show up much in shipments. They fell 1.4% last month (-17.8% y/y) after a 2.2% July increase and they were up just 1.6% from the May low. Computers & electronic products have led the shipments rise with a 5.5% three-month increase but machinery & electrical equipment shipments continued lower. Inventories of durable goods continued lower last month and posted a 1.3% decline which was their eighth consecutive down month (-8.9% y/y). Unfilled orders also continued lower (-10.8% y/y) as they have since last September.
The durable goods figures are available in Haver's USECON database.
Today's remarks by Fed Chairman Ben S. Bernanke can be found here.
| NAICS Classification (%) | August | July | June | Y/Y | 2008 | 2007 | 2006 |
|---|---|---|---|---|---|---|---|
| Durable Goods Orders | -2.4 | 4.8 | -1.1 | -20.2 | -5.8 | 1.4 | 6.2 |
| Excluding Transportation | -0.0 | 0.9 | 2.6 | -18.9 | -1.2 | -0.3 | 9.1 |
| Nondefense Capital Goods | -7.1 | 7.0 | -0.2 | -23.2 | -6.8 | 3.5 | 9.4 |
| Excluding Aircraft | -0.4 | -1.3 | 3.8 | -20.7 | -0.3 | -2.7 | 10.7 |
by Robert Brusca September 25, 2009
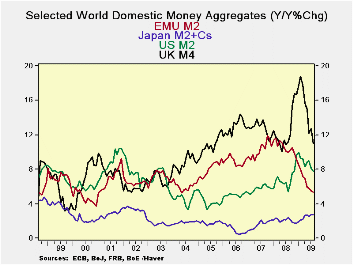
Year-over-year most money supply measures for key countries are still showing solid-to-too-strong growth. The UK is at 11% and the US at 7.8% compared to Japan at 2.8% and EMU at 5.3%. But the developing story is the decay in monetary growth rates and continued weakening credit growth. After pumping out a lot of liquidity in the crisis that same liquidity has to be mopped up. But that is not exactly what is going on, as most of the US ‘liquidity injection’ is still sloshing around on bank balance sheets. In the US bank reserves were expanded greatly but there the story is despite all the ‘excess liquidity’ in the banking system, money growth is decelerating sharply. The high powered money in banks is excessive but what is in the hands of the main economic transactors is growing slowly. US M2 growth has gone from growth of 6.8% Yr/Yr to -2.2% at annual rate over three-months or from 9.4% in real terms to a real 3-month annualized growth rate of -6.8%. The turnaround in the UK is nearly as dramatic. Of course, the US and the UK are banking centers.
IN EMU the story is flat and moderate money growth: 5.3% Yr/Yr and a 5.4% annual rate over three-months. Money supply in the EMU region did not really react that much to the crisis. It had peaked in October 2007 and has been gradually stepping down since then, accelerating its drop since November of 2008. In real terms there is a drop off in EMU money growth from 5.5% Yr-over-year to a three month real annualized rate of growth of 3.4%. At the same time residential credit and loans growth rates have decelerated in EMU. Over three-months residential credit is up at an annual rate of 1% and loans are contracting at an annual rate of 1.3%. In real terms, of course the slowing is even more dramatic and real credit balances are contracting as are real loan balances. Nominal loans to corporations and households are the weakest they have ever been in EMU since data began being collected in 1991.
Year-over-year growth rates for money are contracting in all major monetary centers except in Japan. The most severe Yr/Yr decelerations are in EMU and in the UK. The US deceleration is nascent and has not hit the Yr/Yr profile that hard (see chart).
Much of the problem is the growth of loans. If banks are going to be very tight fisted then the money multiplier will not be a stimulative. Banks have been very cautious in underwriting new credit demands. This remains one of the main obstacles to getting recovery into higher gear in Europe, in the US and in Japan.
| Saar-all | Euro Measures (E13): Money & Credit | G-10 Major Markets: Money | Memo | ||||
| €€-Supply M2 | Credit:Resid | Loans | $US M2 | ££UK M4 | ¥¥Jpn M2+Cds | OIL:WTI | |
| 3-MO | 5.4% | 1.0% | -1.3% | -2.2% | 3.2% | 2.8% | 116.4% |
| 6-MO | 3.1% | -0.6% | -1.9% | 0.8% | 0.5% | 3.1% | 231.6% |
| 12-MO | 5.3% | 2.2% | 0.2% | 7.8% | 11.0% | 2.8% | -39.2% |
| 2-Yr | 7.6% | 6.6% | 4.5% | 6.6% | 11.1% | 2.6% | -1.0% |
| 3-Yr | 8.7% | 8.2% | 6.6% | 6.5% | 12.0% | 2.3% | -0.9% |
| Real Balances: deflated by Own CPI. Oil deflated by US CPI | |||||||
| 3-MO | 3.4% | -1.0% | -3.3% | -6.8% | -0.4% | 4.0% | 106.4% |
| 6-MO | 2.4% | -1.2% | -2.5% | -1.4% | -1.8% | 4.7% | 224.2% |
| 12-MO | 5.5% | 2.3% | 0.4% | 9.4% | 9.3% | 5.0% | -38.3% |
| 2-Yr | 5.7% | 4.7% | 2.6% | 4.6% | 7.7% | 2.6% | -2.8% |
| 3-Yr | 6.8% | 6.3% | 4.7% | 4.5% | 9.0% | 2.4% | -2.8% |
| Japan CPI for Aug is an estimate; it uses the July value to produce the real balance figure | |||||||
by Tom Moeller September 25, 2009
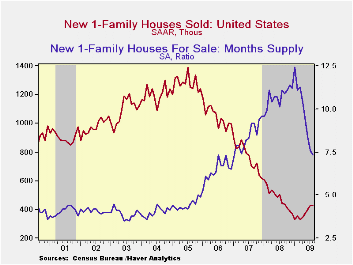
Sales of new single-family homes rose during August for the fifth consecutive month of increase. The seasonally adjusted annual sales rate of 429,000 was up a disappointing 0.7% from a downwardly revised July level of 426,000. Nevertheless, sales have risen by nearly one-third from their January low. August sales fell short of expectations for 440,000.
Price discounts seem to have prompted the latest rise in sales. The median price of a new home fell to $195,200 from an upwardly revised July level. The latest figure, which was down 11.7% y/y, was the lowest level since October of 2003. The average price of a new home was less weak and off 3.3% y/y.
Only sales in the West posted an increase last month. The
12.1% m/m gain was to the highest level since July of last year. Sales
have risen by nearly one-third from their low but were three-quarters
below the 2005 high. That m/m gain in the West was offset by the second
consecutive monthly sales decline in the Midwest. Sales there still
were off by almost one-third from last year and by 81% from their 2003
peak. Sales in the Northeast also reversed most of their July gain with
a 16.3% decline which left them two-thirds below the 2004 peak. In the
South sales were unchanged m/m but still were off by two-thirds from
the 2005 peak.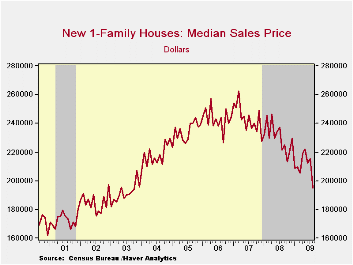
Price discounts, higher sales and much lower housing starts
have combined to lower the overhang of unsold homes. The August decline
dropped them by more than one-third versus last year to the lowest
level since 1992. In the West the number of homes for sale fell to a
record low. The months' supply of unsold homes at 7.3 months was down
from the high of 12.4 months registered in January.
Longer Days, Fewer Weekends is today's speech by Fed Governor Kevin Warsh and it can be found here.
| US New Homes | August | July | June | Y/Y | 2008 | 2007 | 2006 |
|---|---|---|---|---|---|---|---|
| Total Sales (SAAR, 000s) | 429 | 426 | 400 | -3.4% | 481 | 769 | 1,049 |
| Northeast | 36 | 43 | 34 | 28.6 | 35 | 64 | 64 |
| Midwest | 49 | 52 | 62 | -31.9 | 69 | 118 | 161 |
| South | 224 | 224 | 195 | -11.1 | 264 | 408 | 559 |
| West | 120 | 107 | 109 | 30.4 | 113 | 178 | 266 |
| Median Price (NSA, $) | 195,200 | 215,600 | 212,500 | -11.7 | 230,408 | 243,742 | 243,067 |
by Tom Moeller September 25, 2009
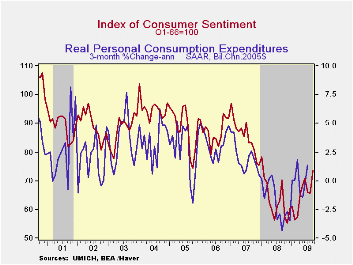 Consumer
sentiment may be showing the effects of the lessened declines recently
logged by overall employment. The University of Michigan's September
reading of consumer sentiment rose to 73.5 from the mid-month reading
of 70.2 and it was up by nearly one-third from the low last Fall.
Consensus expectations had been for a September reading of 70.5. During
the last ten years, there has been a 69% correlation between the level
of sentiment and the growth in real consumer spending during the next
five months.
Consumer
sentiment may be showing the effects of the lessened declines recently
logged by overall employment. The University of Michigan's September
reading of consumer sentiment rose to 73.5 from the mid-month reading
of 70.2 and it was up by nearly one-third from the low last Fall.
Consensus expectations had been for a September reading of 70.5. During
the last ten years, there has been a 69% correlation between the level
of sentiment and the growth in real consumer spending during the next
five months.
The expectations component of the sentiment index rose
the most this month with a 13.1% gain after a 2.8% August rise.
Expected business conditions during the next year jumped 27.5% (35.4%
y/y) to their highest in two years and expectations for conditions
during the next five years rose 13.7% (9.6% y/y).  Expectations for
personal finances rose a lesser 3.6% and remained down from last year.
Inflation expectations for the next year fell sharply to 2.8% which was
the lowest level since March. That compares to a low of 1.7% last
December but remained down from a reading which was as high as 7.0%
during May of last year.
Expectations for
personal finances rose a lesser 3.6% and remained down from last year.
Inflation expectations for the next year fell sharply to 2.8% which was
the lowest level since March. That compares to a low of 1.7% last
December but remained down from a reading which was as high as 7.0%
during May of last year.
The reading of current economic conditions made up the declines during the prior two months with a 10.2% increase. The reading of current personal finances made up all of the August decline with a 19.0% increase but that left it sharply below the year ago level as employment & income remained down. In fact, the reading remained near the record low. Also within the current conditions index was an increase in perceived buying conditions for large household goods that made up declines during the prior two months. (+12.1% y/y).
 The
opinion of government policy,
which may eventually influence economic expectations, made up the
August decline but remained near the lowest level since
February. Thirty one percent of respondents thought that a poor job was
being done by government while 23% thought that a good job was being
done.
The
opinion of government policy,
which may eventually influence economic expectations, made up the
August decline but remained near the lowest level since
February. Thirty one percent of respondents thought that a poor job was
being done by government while 23% thought that a good job was being
done.
The University of Michigan survey data is not seasonally adjusted. The reading is based on telephone interviews with about 500 households at month-end; the mid-month results are based on about 300 interviews. The summary indexes are in Haver's USECON database with details in the proprietary UMSCA database.
| University of Michigan | September | Mid-September | August | Sept y/y | 2008 | 2007 | 2006 |
|---|---|---|---|---|---|---|---|
| Consumer Sentiment | 73.5 | 70.2 | 65.7 | 4.6% | 63.8 | 85.6 | 87.3 |
| Current Conditions | 73.4 | 71.8 | 66.6 | -2.1 | 73.7 | 101.2 | 105.1 |
| Expectations | 73.5 | 69.2 | 65.0 | 9.4 | 57.3 | 75.6 | 75.9 |

Tom Moeller
AuthorMore in Author Profile »Prior to joining Haver Analytics in 2000, Mr. Moeller worked as the Economist at Chancellor Capital Management from 1985 to 1999. There, he developed comprehensive economic forecasts and interpreted economic data for equity and fixed income portfolio managers. Also at Chancellor, Mr. Moeller worked as an equity analyst and was responsible for researching and rating companies in the economically sensitive automobile and housing industries for investment in Chancellor’s equity portfolio. Prior to joining Chancellor, Mr. Moeller was an Economist at Citibank from 1979 to 1984. He also analyzed pricing behavior in the metals industry for the Council on Wage and Price Stability in Washington, D.C. In 1999, Mr. Moeller received the award for most accurate forecast from the Forecasters' Club of New York. From 1990 to 1992 he was President of the New York Association for Business Economists. Mr. Moeller earned an M.B.A. in Finance from Fordham University, where he graduated in 1987. He holds a Bachelor of Arts in Economics from George Washington University.
More Economy in Brief


