 Global| Jul 28 2010
U.S. Durable Goods Orders Decline Unexpectedly
by:Tom Moeller
|in:Economy in Brief
Summary
For June, weakness in durable goods orders was widespread. The advance figures from the Commerce Department indicated a 1.0% decline in orders overall, similar to May's 0.8% drop which was slightly shallower than reported initially. [...]
 For June, weakness in durable goods orders was widespread.
The advance figures from the Commerce Department indicated a 1.0% decline in
orders overall, similar to May's 0.8% drop which was slightly shallower than
reported initially. Nevertheless, the trend toward improvement in the factory
sector continued. The latest decline compared to Consensus expectations for a
1.0% increase.
Transportation sector orders dropped 2.4% (+18.8% y/y) after a 6.6% May decline. Weakness was led by a 25.6% fall (+61.3% y/y) in orders for nondefense aircraft and parts. Offsetting that decline was a 2.9% increase (21.1% y/y) in motor vehicles & parts orders and a 6.5% increase (-24.0% y/y) in defense aircraft. Also to the downside were orders for computers & electronic products which fell 1.9% (+10.7% y/y), although declines were not widespread. In addition, primary metals orders were off by 2.0% (+39.6% y/y). To the upside was a 3.7% gain (19.9% y/y) in electrical equipment, appliance & components.
For the nondefense capital goods sector, overall June orders fell 1.6% after a 0.6% slip during May. Conversely, a 0.6% gain in orders less aircraft added to an upwardly revised 4.6% increase in May.
Shipments of durable goods slipped for the second month with a 0.3% downtick (+10.8% y/y). Weakness was pronounced for computers & electronics which fell 4.1% (+12.6% y/y) but that was offset by a 2.8% increase (5.9% y/y) in transportation equipment. Elsewhere, shipments were firm.
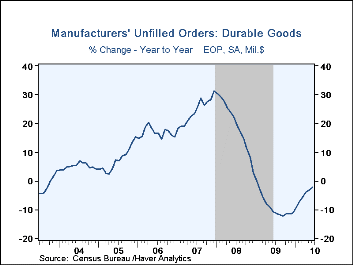
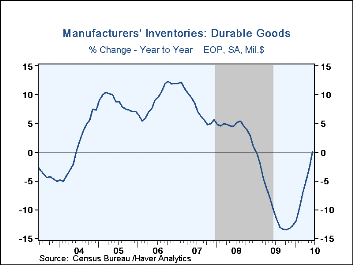
Inventory accumulation continued behind the improvement in orders & shipments. Durable goods inventories rose 0.9% (0.1% y/y) for the fifth consecutive strong monthly increase. Nevertheless, more increases may be on the way as inventories remained 10.7% below the late-2008 peak. Finally, backlogs of durable goods orders slipped marginally and were off 2.2% y/y.
The durable goods figures are available in Haver's USECON database.
What Is the Effect of Financial Stress on Economic Activity? from the Federal Reserve Bank of Kansas City is available here.
| NAICS Classification (%) | June | May | April | Y/Y | 2009 | 2008 | 2007 |
|---|---|---|---|---|---|---|---|
| Durable Goods Orders | -1.0 | -0.8 | 2.9 | 15.9 | -20.7 | -9.0 | 9.7 |
| Excluding Transportation | -0.6 | 1.2 | -0.9 | 15.0 | -18.4 | -2.5 | 4.5 |
| Nondefense Capital Goods | -1.6 | -0.6 | 8.1 | 20.3 | -26.8 | -12.6 | 17.5 |
| Excluding Aircraft | 0.6 | 4.6 | -2.8 | 15.8 | -19.8 | -4.2 | 5.3 |
Tom Moeller
AuthorMore in Author Profile »Prior to joining Haver Analytics in 2000, Mr. Moeller worked as the Economist at Chancellor Capital Management from 1985 to 1999. There, he developed comprehensive economic forecasts and interpreted economic data for equity and fixed income portfolio managers. Also at Chancellor, Mr. Moeller worked as an equity analyst and was responsible for researching and rating companies in the economically sensitive automobile and housing industries for investment in Chancellor’s equity portfolio. Prior to joining Chancellor, Mr. Moeller was an Economist at Citibank from 1979 to 1984. He also analyzed pricing behavior in the metals industry for the Council on Wage and Price Stability in Washington, D.C. In 1999, Mr. Moeller received the award for most accurate forecast from the Forecasters' Club of New York. From 1990 to 1992 he was President of the New York Association for Business Economists. Mr. Moeller earned an M.B.A. in Finance from Fordham University, where he graduated in 1987. He holds a Bachelor of Arts in Economics from George Washington University.
More Economy in Brief
 Global| Feb 05 2026
Charts of the Week: Balanced Policy, Resilient Data and AI Narratives
by:Andrew Cates


