 Global| Jun 27 2007
U.S. Durable Goods Month Down, Trends Still Up - but for How Long?
Summary
The upswing in durable goods trends is still in progress although the weakness in May has reduced much of its clout and blunted the Yr/Yr gain. Durable goods orders are down by a sharp 2.8% m/m in May after gains of 1.1% in April and [...]
The upswing in durable goods trends is still in progress although the weakness in May has reduced much of its clout and blunted the Yr/Yr gain.
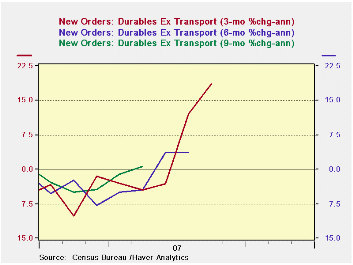
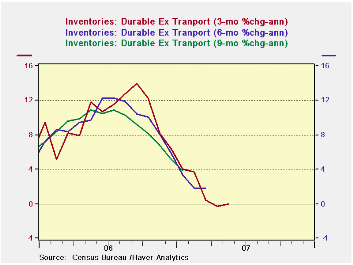
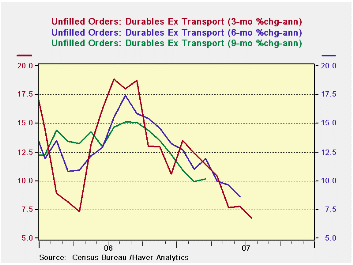
Durable goods orders are down by a sharp 2.8% m/m in May after gains of 1.1% in April and 5.1% in March. For non-transportation the May loss is -1% and compares to gains of 2.5% in April and 1.6% in March. The accompanying chars plot the trends from this series and they are still turning higher. Inventory growth is being cut to zero and order backlog growth is slowing, but still strong.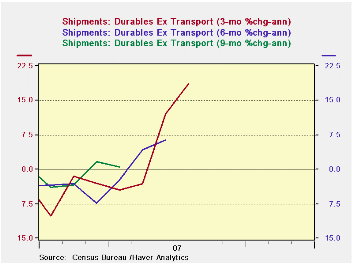
Inventory-to-sales ratios are being cut across sectors as shipment growth surpasses inventory growth in six of seven major industry groups over the past 3 months. That result holds for five of seven industries over a six month horizon as well. Yr/Yr, however, inventory growth has still surpassed the growth in shipments for ALL seven industries, indicating why stock-paring is still going on. Over three months inventories were cut outright in three of seven industries.
These statistics describe a sort of running correction in the durable goods sector. Shipment growth rates are extremely strong (annualized) over the past three months. Six-month growth in shipments is mostly firm to strong across sectors, but much more varied. Yr/Yr shipment growth is mostly modest to weak. So the recent strength has not vaulted trends into a strong positive reading.
Regional MFG surveys released this month carrying data for the month of JUNE have been strong for the most part: NY, Philadelphia and Richmond (the Dallas report that is new and not seasonally adjusted was an exception) were all strong.
Reliability diminished? The monthly pull back in orders is in keeping with the usual volatility of the sector although volatility has grown beyond what has been normal in recent months. Out of 170 observations of 12-month volatility (standard deviation of m/m % changes over a moving 12-month period) the 4.7% volatility reading in May ranks 20th which puts it in the top 12% of all volatility rankings in the past 14 years. And the high volatility is not just ‘May’ it is a result that is shared among recent months. While m/m ex transportation orders do not seem to have become more volatile, the volatility of Yr/Yr ex-transportation orders series is quite high. We have no choice but to admit that the orders series has been blasted with volatility from several sources and has become LESS RELIABLE. There is some evidence that shipments may also have been afflicted with extra volatility.
While the ISM reports and other regional MFG surveys continue to be upbeat, they map into the durable goods data rather too-poorly to assess any change in pattern there. Suffice it so say that with the regional MFG surveys for a more current month so strong it is reasonable to think that the downshift in durable goods orders in May is not some step back but is still part of what erratic orders do in an expanding cycle. Still, with this sort of sharp drop in May orders, all eyes will be more firmly glued on what happens in June.
  |
| Inventory-Shipment Balance By Major MFG Sector and Tenor | ||||||
|---|---|---|---|---|---|---|
| 2007.May | 3-months | 6-months | 12-months | |||
| Major Sectors | Shipments | Inventory | Shipments | Inventory | Shipments | Inventory |
| Primary metals | 36.5% | 6.7% | 14.9% | 1.5% | 4.1% | 10.8% |
| Fabricated Metal Products | 10.9% | 1.5% | 7.9% | 2.2% | 1.9% | 7.2% |
| Machinery | 24.2% | 2.5% | 3.3% | 7.9% | 2.2% | 7.2% |
| Computers and Electronics | 25.3% | -4.0% | 6.5% | -1.5% | 3.6% | 5.0% |
| Electrical Equipment, Appliances & Computers | 9.2% | -1.1% | 13.6% | 2.0% | 4.0% | 7.3% |
| Transportation Equipment | 10.4% | 12.0% | 0.6% | 7.4% | -2.1% | 7.7% |
| All Other Durables | 8.2% | -3.6% | 1.3% | -1.0% | -4.0% | 2.0% |
| % Sectors with rising I/S Ratio: | 14.29% | -- | 28.57% | -- | 100.00% | -- |
by Robert Brusca June 27, 2007
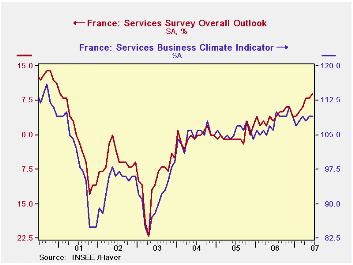
French climate and outlook are on a strong improving trend.
The services sector is still doing well. The climate and outlook indicators are strong in their respective ranges. Observed and expected sales are still strong but both are off peak. Observed and expected employment indicators are also off peak. The expected responses for these two indicators are sharply lower in June. Expected series are firm but only in about the 60th percentile of their respective ranges.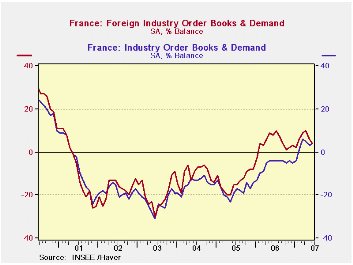
The second table below summarizes France’s Industry survey for June. The report scrapped and got back two of the four points it lost in May. The trends are still firm with climate nearly in the upper 25 percentile of its range. Recent and likely trend assessments spurted in June. Foreign and also domestic orders are slipping slightly with both having peaks in April.
| Jun-07 | May-07 | Apr-07 | Mar-07 | Percentile | Rank | Max | Min | Range | Mean | |
| Climate Indicator | 109 | 109 | 108 | 109 | 78.8 | 8 | 116 | 83 | 33 | 102 |
| Climate: 3-Mo MAV | 109 | 109 | 108 | 108 | 81.6 | 14 | 114 | 85 | 29 | 102 |
| Climate: 12-Mo MAV | 109 | 109 | 109 | 108 | 92.4 | 3 | 110 | 91 | 20 | 101 |
| Outlook | 9 | 8 | 8 | 6 | 86.1 | 6 | 14 | -22 | 36 | -1 |
| Sales | ||||||||||
| Observed 3-Mos | 14 | 17 | 12 | 11 | 83.3 | 9 | 19 | -11 | 30 | 6 |
| Expected 3-Mos | 12 | 14 | 13 | 14 | 68.8 | 19 | 22 | -10 | 32 | 7 |
| Sales Price | ||||||||||
| Observed over 3-Mos | 1 | 0 | 2 | -2 | 41.7 | 29 | 8 | -4 | 12 | 0 |
| Expected over 3-Mos | 1 | 3 | 0 | -1 | 60.0 | 38 | 5 | -5 | 10 | 1 |
| Employment | ||||||||||
| Observed over 3-Mos | 13 | 15 | 13 | 12 | 70.6 | 11 | 23 | -11 | 34 | 5 |
| Expected over 3-Mos | 10 | 16 | 8 | 11 | 60.0 | 17 | 20 | -5 | 25 | 5 |
| Since Jan 1990 | Since Jan 1990 | |||||||||
| Jun-07 | May-07 | Apr-07 | Mar-07 | Percentile | Rank | Max | Min | Range | Mean | |
| Climate | 110 | 108 | 112 | 109 | 74.0 | 41 | 123 | 73 | 50 | 101 |
| Production | ||||||||||
| Recent Trend | 24 | 14 | 10 | -2 | 80.4 | 30 | 44 | -58 | 102 | -6 |
| Likely trend | 28 | 22 | 21 | 23 | 63.5 | 33 | 63 | -33 | 96 | 7 |
| Orders/Demand | ||||||||||
| Orders & Demand | 4 | 3 | 5 | 6 | 75.9 | 27 | 25 | -62 | 87 | -15 |
| Foreign Orders & Demand | 4 | 6 | 10 | 9 | 69.7 | 48 | 31 | -58 | 89 | -11 |
| Prices | ||||||||||
| Likely Sales Prices Trend | 9 | 9 | 4 | 10 | 68.1 | 31 | 24 | -23 | 47 | 0 |
by Carol Stone June 27, 2007
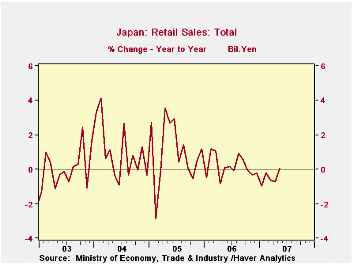
We fret over the Japanese economy: is it improving or not? Is it finally breaking out of 1990s stagnation enough so that deflation will go away? We're never quite sure. So when one figure is favorable, even by a little bit, we tend to get excited about it.
Today it is retail sales. In May, consumer purchases of goods in stores rose 0.1% from a year ago. The Bloomberg news service reports that of the 23 economists in its Japanese forecast survey, only 1 predicted a positive outcome for this indicator. It was the first 12-month increase since last September.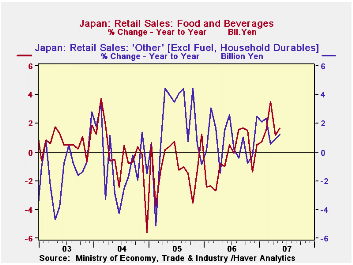
We thought perhaps rising fuel prices had been the main mover. This had certainly been the case from about mid-2004 through mid-2006. But fuel purchases have slowed recently and for May they actually edged down from May 2006, by 0.4%. Excluding fuel, retail sales were still up 0.1%.
The largest single gain was in food and beverages, which rose 1.7%. Other categories of stores -- motor vehicle dealers, clothing, household durable goods and general merchandise -- all still saw year-on-year decreases. So it's the "all other" segment that helped push up the total: books, sporting goods, personal care items. These increased 1.3% over the year ago.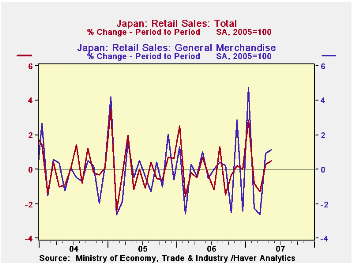
The narrow scope of the May sales increase might suggest that it will turn out to be fleeting. However, the Ministry of Economy, Trade and Industry (METI) also calculates an index, which they seasonally adjust. As shown in the table below, this index rose 0.5% in May from April, which had been up 0.3% from March. By this measure, general merchandise store sales were up in May, as were clothing stores and "other", suggesting that recent uptrends have been broadening, giving a more optimistic view going forward. Thus, Japanese consumers, who face an increasing positive employment situation and the lowest unemployment since early 1998, might be starting to spend more freely. The threads of evidence from this retail sales report are thin, but they look to be braiding a stronger rope.
| JAPAN: Retail Sales | May 2007 | Apr 2007 | Mar 2007 | Year Ago | Monthly Averages|||
|---|---|---|---|---|---|---|---|
| 2006 | 2005 | 2004 | |||||
| Total (Bil.¥) | 11,012 | 11,177 | 12,077 | 11,005 | 11,271 | 11,255 | 11,143 |
| % Change | 0.5* | 0.3* | -1.3* | 0.1 | 0.2 | 1.0 | 1.0 |
| ex Fuel | 0.1 | -0.6 | -0.2 | 0.4 |

Robert Brusca
AuthorMore in Author Profile »Robert A. Brusca is Chief Economist of Fact and Opinion Economics, a consulting firm he founded in Manhattan. He has been an economist on Wall Street for over 25 years. He has visited central banking and large institutional clients in over 30 countries in his career as an economist. Mr. Brusca was a Divisional Research Chief at the Federal Reserve Bank of NY (Chief of the International Financial markets Division), a Fed Watcher at Irving Trust and Chief Economist at Nikko Securities International. He is widely quoted and appears in various media. Mr. Brusca holds an MA and Ph.D. in economics from Michigan State University and a BA in Economics from the University of Michigan. His research pursues his strong interests in non aligned policy economics as well as international economics. FAO Economics’ research targets investors to assist them in making better investment decisions in stocks, bonds and in a variety of international assets. The company does not manage money and has no conflicts in giving economic advice.
More Economy in Brief


