 Global| Jun 18 2008
U.S. Current Account Deficit Slightly Deeper in 1Q'08
by:Tom Moeller
|in:Economy in Brief
Summary
During 1Q'08, the US current account deficit deepened slightly to $176.4 billion from a revised $167.2 billion during last year's final quarter. The Q1 deficit was deeper than the Consensus expectation for a figure of $173 billion. [...]
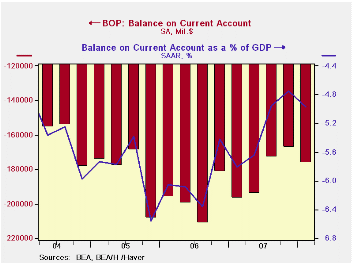
During 1Q'08, the US current account deficit deepened slightly to $176.4 billion from a revised $167.2 billion during last year's final quarter. The Q1 deficit was deeper than the Consensus expectation for a figure of $173 billion.
The deepening pulled the deficit to 5.0% of GDP. That percentage has been fairly stable during the last three quarters and it is much reduced from its peak percentage late in 2005, of 6.5% of GDP.
During 1Q, the deficit on goods trade deepened slightly to
$211.0 billion as higher oil prices raised imports by 3.3%. That
increase was enough to deepen the deficit even though exports rose by a
stronger 4.8% because imports are the greater total. The deficit on
goods trade has been fairly steady near $200 billion since late-2005.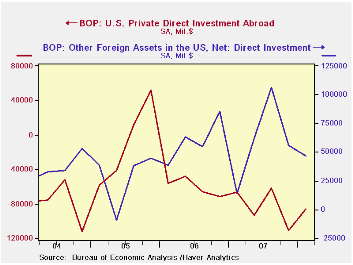
The effects of the lower U.S. dollar and the strength of foreign economies versus the U.S. continued to be apparent in the surplus in services trade. It grew to a record $36.1B, and prior figures were revised to show a larger surplus. Exports of travel services grew 23.1% y/y and passenger fares were up 23.9%, after a very much upwardly revised 30.9% y/y 4Q increase. Imports grew 28.9% but travel imports grew 73.4%. They have nearly doubled y/y while passenger fares grew 9.3% (19.8% y/y).
The trade surplus on earned income narrowed to $29.8B as the unilateral transfers deficit deepened to $31.2 billion.
From the capital account, the deficit on private direct investment narrowed to $39.0 billion from $52.7 billion in 1Q '07 as the level of foreign investment more than tripled versus the year earlier level.
Challenges for Health-Care Reform is yesterday's speech by Federal Reserve Board Chairman Ben S. Bernanke and it can be found here
| US Balance of Payments, Bil.$, SA | 1Q '08 | 4Q '07 | Year Ago | 2007 | 2006 | 2005 |
|---|---|---|---|---|---|---|
| Current Account Balance ($ Bil.) | -176.4 | -167.2 | -196.9 | -731.2 | -788.1 | -729.0 |
| Deficit % of GDP | -5.0 | -4.8 | -5.8 | -5.3 | -6.0 | -5.9 |
| Balance on Goods ($ Bil.) | -211.0 | -208.9 | -203.3 | -819.4 | -838.3 | -787.1 |
| Exports | 4.8% | 2.6% | 17.6% | 12.3% | 14.4% | 10.8% |
| Imports | 3.3% | 3.1% | 11.6% | 5.7% | 10.7% | 13.9% |
| Balance on Private Services ($ Bil.) | 36.1 | 35.1 | 23.8 | 119.1 | 85.0 | 75.6 |
| Exports | 4.4% | 4.9% | 15.2% | 13.4% | 8.8% | 11.1% |
| Imports | 3.3% | 0.9% | 9.9% | 8.4% | 11.3% | 7.7% |
| Balance on Income ($ Bil.) | 29.8 | 36.3 | 12.9 | 81.8 | 57.2 | 67.2 |
| Unilateral Transfers ($ Bil.) | -31.2 | -29.8 | -30.2 | -112.7 | -92.0 | -89.8 |
by Robert Brusca June 18, 2008

UK orders snapped back to a thin +1 reading for June after -10
net balance reading in May and a deeper decline for April. But the
story is that price pressures continue to rage at intense levels at a
+28 reading for the July-Sep period barely down from +30 for June-Aug
despite some substantial order weakness in earlier months. Export
orders made some recovery in June but still posted a net balance
reading of -5 up from -12 in May. Stock building was halved from a new
reading of +16 to +8 in June.
After having embarked on path of rate cuts, the BOE is having
real second thoughts. In its last meeting it was just revealed that the
BOE actually considered a rate hike. That news shook sterling markets
on the day. With the CIPS report we can see why the BOE is thinking of
changing course. Firms are planning price increases on a broad scale
and the BOE is currently not happy with the prevailing over-the-target
inflation performance it has helped to engineer. With the revelation
that the BOE considered a rate hike (but held back) it joins the ranks
of other central banks, notably the ECB and the Fed, that are planning
to hike rates or warning of the possibility of hiking.
| UK Industrial volume data CBI Survey | |||||||||
|---|---|---|---|---|---|---|---|---|---|
| Reported: | Jul 08 |
Jun 08 |
May 08 |
Apr 08 |
12MO Avg | Pcntle | Max | Min | Range |
| Total Orders | #N/A | 1 | -10 | -13 | 1 | 84% | 9 | -40 | 49 |
| Export Orders | #N/A | -5 | -12 | -12 | -5 | 83% | 3 | -43 | 46 |
| Stocks: Final Goods | #N/A | 8 | 16 | 12 | 11 | 36% | 26 | -2 | 28 |
| Looking ahead | |||||||||
| Output Volume: Next 3M | 11 | 2 | 0 | 0 | 8 | 54% | 28 | -28 | 56 |
| Avg Prices 4 Next 3M | 28 | 30 | 25 | 25 | 21 | 100% | 30 | -29 | 59 |
| From end 2000 | |||||||||
| Compare to CIPS MFG | |||||||||
| May 08 |
Apr 08 |
Mar 08 |
Feb 08 |
12MO Avg | Pcntle | Max | Min | Range | |
| UK MFG | 50.03 | 50.81 | 51.14 | 51.19 | 52.76 | 42% | 56.32 | 45.46 | 11 |
by Robert Brusca June 18, 2008
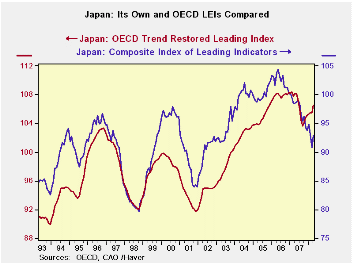
Japan’s LEI was unrevised in April but continues to fall at an
accelerating pace. Over 12-mos the index fell at a 5.7% pace, over
six-months the rate of decline is at a rate of 6.9% and over the recent
three months ended in April the index is falling at an 8.2% annual
rate. But compare the composite leading indicators for Japan with that
from the OECD. The OECD measure has rebounded and is continuing to show
an up-cycle. This is cropping up to be one of the larger divergences
between the OECD CLI and Japan’s LEI.
| Japan's LEI and its trends | |||||||
|---|---|---|---|---|---|---|---|
| Levels | Growth (saar) | ||||||
| Apr-08 | Mar-08 | Feb-08 | 3M0 | 6M0 | 12Mo | 24MO | |
| LEI | 92.8 | 90.8 | 93.1 | -8.2% | -6.9% | -5.7% | -10.6% |
| LEI: OECD | 106.6 | 105.5 | 105.5 | 5.0% | 4.7% | -1.5% | -1.5% |
| OECD LEI details | |||||||
| Share P | 1.0 | 1.0 | 1.0 | -12.6% | -36.2% | -24.5% | -25.7% |
| Interest Spread (chngs) | -0.3 | -0.7 | -0.5 | 0.2 | 0.0 | -0.2 | -1.0 |
| Loan/Deposit | #N/A | 1.1 | 1.1 | 6.5% | 4.2% | 3.1% | 6.9% |
| Dwellings Started | 1.0 | 1.0 | 1.0 | -10.8% | 83.7% | -7.2% | -9.6% |
| OT-MFG | #N/A | 1.0 | 1.0 | 0.0% | -2.0% | -1.0% | -4.9% |
| Stocks/Delivery (M&M) | #N/A | #N/A | 1.0 | #N/A | #N/A | #N/A | #N/A |
| Exp>Imp | 0.0 | -0.1 | -0.1 | -97.4% | -71.0% | 110.0% | -150.0% |
| SmallBiz | #N/A | #N/A | #N/A | #N/A | #N/A | #N/A | #N/A |
| Grey shaded rows are one month behind current; Small Biz lags by six months | |||||||

Tom Moeller
AuthorMore in Author Profile »Prior to joining Haver Analytics in 2000, Mr. Moeller worked as the Economist at Chancellor Capital Management from 1985 to 1999. There, he developed comprehensive economic forecasts and interpreted economic data for equity and fixed income portfolio managers. Also at Chancellor, Mr. Moeller worked as an equity analyst and was responsible for researching and rating companies in the economically sensitive automobile and housing industries for investment in Chancellor’s equity portfolio. Prior to joining Chancellor, Mr. Moeller was an Economist at Citibank from 1979 to 1984. He also analyzed pricing behavior in the metals industry for the Council on Wage and Price Stability in Washington, D.C. In 1999, Mr. Moeller received the award for most accurate forecast from the Forecasters' Club of New York. From 1990 to 1992 he was President of the New York Association for Business Economists. Mr. Moeller earned an M.B.A. in Finance from Fordham University, where he graduated in 1987. He holds a Bachelor of Arts in Economics from George Washington University.
More Economy in Brief


