Haver Analytics
Haver Analytics
Global| Mar 19 2014

U.S. Current Account Deficit Shrinks to its Least Since 1999

Summary

Last quarter's deficit on merchandise trade shrank to $171.8 billion, its least in three years.

U

The U.S. current account deficit decreased in Q4'13 to $81.1 billion from $96.4 billion in Q3. It was the smallest quarterly deficit since Q3 1999. It represented 1.9% of GDP, the least since Q3 1997. The ACTION ECONOMICS FORECAST SURVEY called for a deficit of $88.2 billion. For all of last year, the deficit shrank to $379.3, its least since 1999. Exports of goods, services and income grew 2.5% in Q4 (4.2% y/y), while imports edged up 0.7% (1.3% y/y). For the full year, exports of goods, services & income gained 2.5% after a 3.9% rise in 2012. Imports ticked up 0.3% last year after a 3.1% increase in 2012.

Last quarter's deficit on merchandise trade shrank to $171.8 billion, its least in three years. Goods exports rose 1.9% (3.8% y/y) last quarter, the strongest rise since Q3'11. Imports of goods increased marginally in Q4, up 0.8% y/y. The year's deficit of $703.9 billion was the smallest since the recession year of 2009.   

The trade surplus on services improved to $57.9 billion. Services exports increased 1.7% (4.5% y/y). Travel exports gained 2.1% (10.3% y/y) and passenger fares improved 2.8% (6.7% y/y). Imports of services rose 1.6% (4.1% y/y), as travel imports were up 2.7% (7.1% y/y). The $229.0 billion surplus on services trade last year set another record.

The surplus on income improved to a record $64.4 billion as receipts from abroad grew 4.7% y/y and payments to foreigners increased 1.3%. For the year, the surplus improved to a near-record $228.8 billion. 

From the capital account, the deficit on private direct investment abroad improved during the year to $166.3 billion, its least since 2010.   

Balance of Payments data are in Haver's USINT database, with summaries available in USECON. The expectations figure is in the AS1REPNA database.

US Balance of Payments SA Q4'13 Q3'13 Q1'13 2013 2012 2011
Current Account Balance ($ Billion) -81.1 -96.4 -96.8 -379.3 -440.4 -457.7
  Deficit % of GDP -1.9% -2.3% -2.3% -2.3% -2.7% -3.0%
 Balance on Goods ($ Billion) -171.8 -178.4 -175.0 -703.9 -741.5 -744.1
  Exports 1.9% 0.6% 1.0% 1.8% 4.4% 16.1%
  Imports 0.2% 1.0% 0.0% -0.4% 2.8% 15.5%
 Balance on Services ($ Billion) 57.9 56.9 57.5 229.0 206.8 187.3
  Exports 1.7% 0.5% 1.7% 5.0% 5.2% 11.0%
  Imports 2.4% -0.7% -0.9% 1.4% 4.6% 5.6%
 Balance on Income ($ Billion) 64.4 59.1 55.2 228.8 223.9 232.6
Unilateral Transfers ($ Billion) -31.6 -34.0 -34.5 -133.2 -129.7 -133.5
U.S. Mortgage Loan Applications Decline Further
by Tom Moeller  March 19, 2014

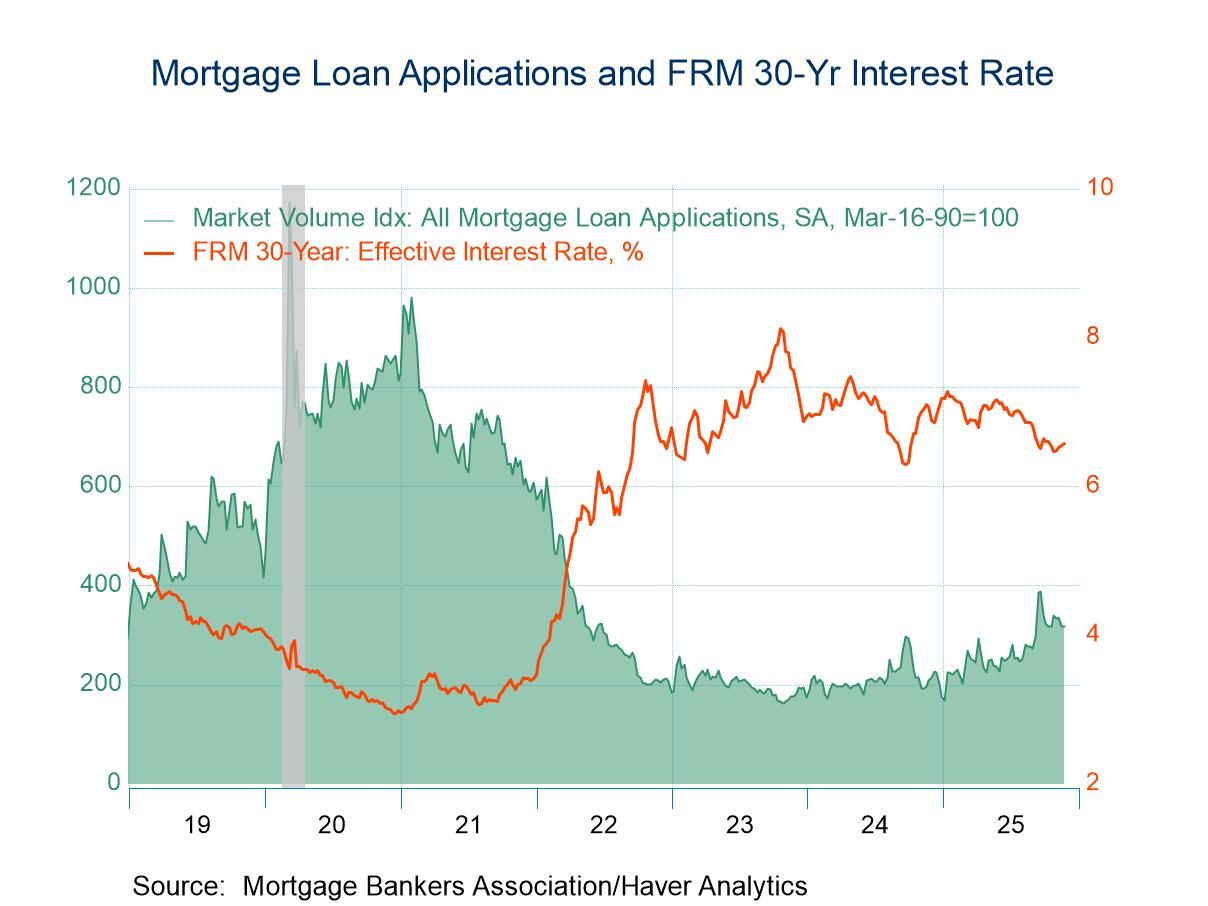
The Mortgage Bankers Association indicated that their total mortgage market index fell 1.2% last week (-51.8% y/y). Applications remained 63.3% lower than the peak in September 2012. Applications to purchase a home slipped 0.9% (-14.8% y/y) and were 24.2% below the peak this past May. Applications to refinance a loan declined 1.3% (-62.8% y/y) and were 74.0% below the peak in September 2012.

The effective interest rate on a 15-year mortgage was little-changed at 3.58%, up from the 2.89% low early in May of 2013. The effective rate on a 30-year fixed rate loan of 4.58% last week also remained higher than the 3.68% last May. Finally, the rate on a Jumbo 30-year loan of 4.45% compared to a low of 3.85%. For adjustable 5-year mortgages, the effective interest rate at 3.24% remained up from its low of 2.59% at the beginning of May, 2013.

Applications for fixed interest rate loans slipped 0.7% (-53.3% y/y) and were 65.3% below the September 2012 high while adjustable rate loan applications were off 6.2% (-20.0% y/y) and were 39.1% below last June's high. The average mortgage loan size slipped to $233,900 but still was up sharply from the $209,000 averaged in February of last year. The average loan size for home purchases slipped to $272,100 last week and for refinancings it was $204,500.

The survey covers over 75 percent of all U.S. retail residential mortgage applications, and has been conducted weekly since 1990. Respondents include mortgage bankers, commercial banks and thrifts. The base period and value for all indexes is March 16, 1990=100. The figures for weekly mortgage applications and interest rates are available in Haver's SURVEYW database.

MBA Mortgage Applications (SA, 3/16/90=100) 03/14/14 03/07/14 02/28/14 Y/Y% 2013 2012 2011
Total Market Index 369.0 373.3 381.4 -51.8 616.6 813.8 572.3
 Purchase 167.3 168.8 169.6 -14.8 197.5 187.8 182.6
 Refinancing 1,528.4 1,547.9 1,597.6 -62.8 3,070.0 4,505.0 2,858.4
15-Year Mortgage Effective Interest Rate (%) 3.58 3.60 3.57 3.10
(3/13)
3.42 3.25 3.97
FOMC Pares Back Bond Purchases; Worries About Inflation Running Too Low
by Tom Moeller  March 19, 2014

At today's meeting of the Federal Open Market Committee, the Fed reduced the amount of its asset purchases of agency mortgage-backed and longer-term Treasury securities to $55 billion per month from $65 per month. It sighted broader economic strength and improvement in the labor market as rationales for the move.

The Federal funds rate was left unchanged in a range of 0.00% - 0.25% and the discount rate remained at 0.75%.

Economic goals continued to be consumer price inflation of 2 percent and maximum employment. Worries about economic performance were voiced if inflation continued to run under its objective, suggesting that a 6.5% unemployment rate might not be a firm target. 

GDP growth was projected for this year of 2.8% to 3.0% and next year of 3.0% to 3.2%. The unemployment rate target this year was reduced to 6.1% to 6.3% and next year to 5.6% to 5.9%. Core PCE inflation forecasts were left roughly unchanged at 1.4% to 1.6% this year and 1.7% to 2.0% for 2015.

The press release for today's FOMC meeting can be found http://www.federalreserve.gov/newsevents/press/monetary/20140319a.htm

Haver's SURVEYS database contains the projections from the Federal Reserve Board.

Current Last 2013 2012 2011 2010
Federal Funds Rate, % (Target) 0.00-0.25 0.00-0.25 0.11 0.14 0.10 0.17
Discount Rate, % 0.75 0.75 0.75 0.75 0.75 0.72
  • Prior to joining Haver Analytics in 2000, Mr. Moeller worked as the Economist at Chancellor Capital Management from 1985 to 1999. There, he developed comprehensive economic forecasts and interpreted economic data for equity and fixed income portfolio managers. Also at Chancellor, Mr. Moeller worked as an equity analyst and was responsible for researching and rating companies in the economically sensitive automobile and housing industries for investment in Chancellor’s equity portfolio.   Prior to joining Chancellor, Mr. Moeller was an Economist at Citibank from 1979 to 1984.   He also analyzed pricing behavior in the metals industry for the Council on Wage and Price Stability in Washington, D.C.   In 1999, Mr. Moeller received the award for most accurate forecast from the Forecasters' Club of New York. From 1990 to 1992 he was President of the New York Association for Business Economists.   Mr. Moeller earned an M.B.A. in Finance from Fordham University, where he graduated in 1987. He holds a Bachelor of Arts in Economics from George Washington University.

    More in Author Profile »

More Economy in Brief