 Global| Dec 17 2007
U.S. Current Account Deficit Eased Further in Q3
by:Tom Moeller
|in:Economy in Brief
Summary
The US current account deficit fell further last quarter to $178.5 billion from $188.9 billion in Q2, a figure that was revised slightly shallower. The Q3 deficit was shallower than Consensus expectations for a deficit of $183.3 [...]
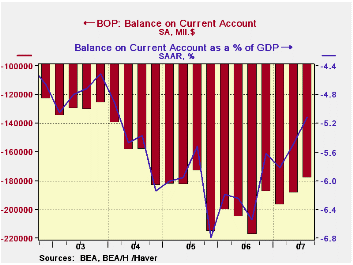
The US current account deficit fell further last quarter to $178.5 billion from $188.9 billion in Q2, a figure that was revised slightly shallower. The Q3 deficit was shallower than Consensus expectations for a deficit of $183.3 billion.
The latest deficit totaled 5.1% of GDP and it peaked as a percentage of GDP nearly two years ago at 6.8% in Q4 2005.
That shrinkage occurred as the deficit on merchandise trade
improved slightly $199.7B from Q2's deficit of $204.2B and from its
deepest shortfall a year ago of $219.9B During the last year only,
exports grew 10.0% and outpaced the 4.4% y/y growth in imports.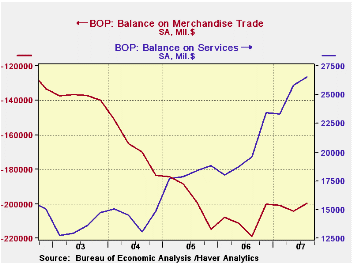
The effects of the lower U.S. dollar and the strength of foreign economies versus the U.S. is apparent most decisively in the surplus in services trade. It improved markedly to a record surplus of $26.5B from $25.8B in 2Q. Exports of services during the last year alone grew 14.3%. Travel exports grew 17.7% y/y, passenger fares were up 10.9% and freight shipping grew 11.3%. Import growth, conversely was contained to 9.2% due to moderate 7.7% growth in travel, 4.8% growth in passenger fares and a slight 1.4% advance in private freight transportation.
Foreign trade zones from the Federal
Reserve Bank of Minneapolis can be found
here.
| US
Balance of Payments, Bil.$, SA |
Q3 2007 | Q2 2007 | Year Ago | 2006 | 2005 | 2004 |
|---|---|---|---|---|---|---|
| Current Account Balance ($ Bil.) | -178.5 | -188.9 | -217.3 | -811.5 | -754.8 | -640.2 |
| Deficit % of GDP | -5.1 | -5.5 | -6.6 | -6.2 | -6.1 | -5.5 |
| Balance on Goods ($ Bil.) | -199.7 | -204.2 | -218.9 | -838.3 | -787.1 | -669.6 |
| Exports | 3.5% | 1.2% | 11.0% | 12.7% | 10.9% | 13.7% |
| Imports | 2.4% | 0.9% | 4.4% | 10.4% | 12.9% | 16.8% |
| Balance on Private Services ($ Bil.) | 26.5 | 25.8 | 19.6 | 79.8 | 72.8 | 57.5 |
| Exports | 2.4% | 5.1% | 14.3% | 9.9% | 10.5% | 14.7% |
| Imports | 2.2% | 3.1% | 9.2% | 9.3% | 8.7% | 16.8% |
| Balance on Income ($ Bil.) | 20.5 | 12.7 | 5.9 | 36.6 | 48.1 | 56.4 |
| Unilateral Transfers ($ Bil.) | -25.8 | -23.2 | -23.9 | -89.6 | -88.5 | -88.4 |
by Tom Moeller December 17, 2007
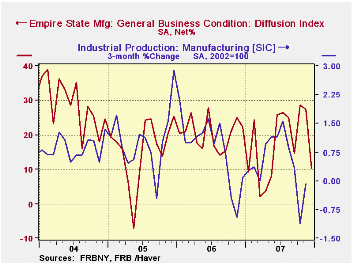
The December index of manufacturing activity in New York State fell sharply to the lowest level since this past May. The level of 10.31 was half the expected 20. The figures are reported by the Federal Reserve Bank of New York.
Since the series' inception in 2001 there has been a 55% correlation between the index level and the three month change in U.S. factory sector industrial production.
New orders and shipments fell sharply but employment improved slightly.
In the (perhaps too) short six year history of the NY employment index, there has been an 85% correlation between it and the three month growth in overall factory sector employment.
Like the Philadelphia Fed Index of General Business Conditions, the Empire State Business Conditions Index reflects answers to an independent survey question; it is not a weighted combination of the components.
Pricing pressure also fell to its lowest level since August. Since 2001 there has been an 81% correlation between the index of prices paid and the three month change in the core intermediate materials PPI.
The Empire State index of expected business conditions in six months improved but only slightly and remained near its lowest in six years.
The Empire State Manufacturing Survey is a monthly survey of manufacturers in New York State conducted by the Federal Reserve Bank of New York. Participants from across the state in a variety of industries respond to a questionnaire and report the change in a variety of indicators from the previous month. Respondents also state the likely direction of these same indicators six months ahead. April 2002 is the first report, although survey data date back to July 2001.
For more on the Empire State Manufacturing Survey, including methodologies and the latest report, click here.
| Empire State Manufacturing Survey | December | November | Dec. '06 | 2007 | 2006 | 2005 |
|---|---|---|---|---|---|---|
| General Business Conditions (diffusion index) | 10.31 | 27.37 | 22.19 | 17.13 | 20.33 | 15.62 |
| Prices Paid | 35.00 | 42.86 | 28.09 | 35.64 | 41.88 | 44.74 |
by Louise Curley December 17, 2007
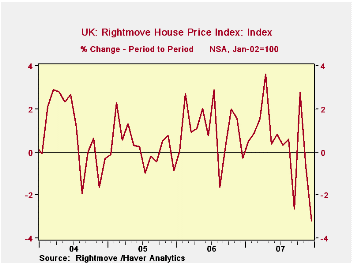
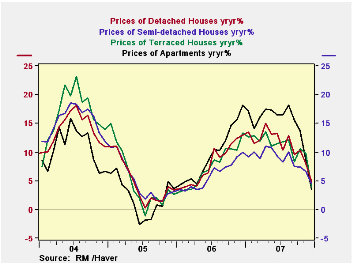
Another indicator of trouble in the U.K.'s housing market, the Rightmove House Price Index, fell 3.2% in December, the largest month to month decline since its inception in January, 2002, as can be seen in the first chart. This index is based on the asking prices of properties coming to market at Rightmove Co.'s more than 11,500 estate agency branches. It is based on actual prices and actual properties rather than on surveys of opinions about prices. The sample includes some 200,000 houses each month, representing about 80% of the market.
In addition to its Index, the Rightmove Co. has been publishing average prices of various types of houses--detached, semi-detached, terraced, and apartments. In December, the steepest declines took place in the terraced houses and apartments. While the prices of all types of house have declined in recent months, the prices are still above year ago levels. However, the year to year increases in the prices of all types of houses have been declining in the last half of this year, as can be seen in the second chart.
| U.K. RIGHTMOVE CO. | Dec 07 | Nov 07 | Dec 06 | M/M %Chg | Y/Y %Chg | 2007 | 2006 | 2005 |
|---|---|---|---|---|---|---|---|---|
| House Price Index (Jan 2002=100) | 189.1 | 195.3 | 180.4 | -3.17 | 4.82 | 191.2 | 172.0 | 159.4 |
| Asking Prices for Types of Houses (UK Pounds) | ||||||||
| Detached | 334039 | 339675 | 316003 | -1.66 | 5.71 | 336295 | 306255 | 284840 |
| Semi-detached | 205759 | 208794 | 196846 | -1.45 | 4.53 | 205645 | 189353 | 178630 |
| Terraced | 180224 | 187844 | 173372 | -4.06 | 3.95 | 182.661 | 164886 | 153475 |
| Apartments | 193973 | 200875 | 187434 | -3.44 | 3.49 | 196167 | 171504 | 156489 |
by Robert Brusca December 17, 2007
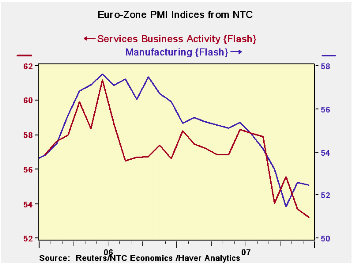
The NTC MFG and Services indices for the E-zone slipped in
December in their flash release. Services are below their three month
and six month and 12-month average values. Manufacturing is too, except
for the three month comparison. The Service index stand in the bottom
of its 24 month range. For the same period Manufacturing is in the
bottom 16 percent of its range. Although the manufacturing index has a
much longer history and in its full sample of observations (back to
June 1997) it resides in the 54th percentile of its range and it is
just 0.5% below its long term average reading.
The Flash data show us that the Euro Area is still weak and
losing momentum. But the chart also shows that the momentum loss is not
accelerating. Services continue to look bad in terms of momentum, but
manufacturing fell and bounced and is now eroding at a much more
moderate pace.
| FLASH Readings | ||
|---|---|---|
| NTC PMIs for the E-Zone-13 | ||
| MFG | Services | |
| Dec-07 | 52.46 | 53.23 |
| Nov-07 | 52.60 | 53.72 |
| Oct-07 | 51.46 | 55.56 |
| Sep-07 | 53.21 | 54.04 |
| Averages | ||
| 3-Mo | 52.17 | 54.17 |
| 6-Mo | 53.12 | 55.43 |
| 12-Mo | 54.24 | 56.46 |
| 24-Mo Range | ||
| High | 57.61 | 61.21 |
| Low | 51.46 | 53.23 |
| % Range | 16.3% | 0.0% |
by Robert Brusca December 17, 2007
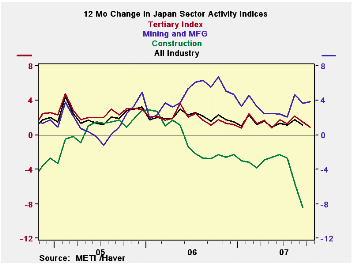
As we saw earlier, Japan’s mining and manufacturing index is holding up after some special factors weakened it earlier in the year. Now the tertiary index is stabilizing in October. It rose to 110.9 in October but its 12 month change is still eroding (see chart). Japan’s Construction sector (not yet available for Oct) is clearly the weak sector. Manufacturing is recovering from some weather disasters earlier in the year. The tertiary index, representing the more stable services sector is rather plodding along. As a result the overall all industries index (also not yet available for Oct) has shown small increases but has been on the positive side of those Yr/Yr changes.
| Up to date Japan Industry Surveys | |||||||||
|---|---|---|---|---|---|---|---|---|---|
| Recent Months | Moving Averages | Extremes: Range | |||||||
| Oct-2007 | Sep-2007 | Aug-2007 | 3-Mo | 6-Mo | 12-Mo | Max | Min | %-Tile | |
| Mining and MFG | 112.2 | 110.3 | 111.9 | 111.5 | 109.7 | 108.9 | 112.2 | 87.7 | 100.0% |
| Tertiary | 110.4 | 109.2 | 111.2 | 110.3 | 110.2 | 109.9 | 111.2 | 91.0 | 96.0% |
| Ranges, Max, Min since 1993 | |||||||||

Tom Moeller
AuthorMore in Author Profile »Prior to joining Haver Analytics in 2000, Mr. Moeller worked as the Economist at Chancellor Capital Management from 1985 to 1999. There, he developed comprehensive economic forecasts and interpreted economic data for equity and fixed income portfolio managers. Also at Chancellor, Mr. Moeller worked as an equity analyst and was responsible for researching and rating companies in the economically sensitive automobile and housing industries for investment in Chancellor’s equity portfolio. Prior to joining Chancellor, Mr. Moeller was an Economist at Citibank from 1979 to 1984. He also analyzed pricing behavior in the metals industry for the Council on Wage and Price Stability in Washington, D.C. In 1999, Mr. Moeller received the award for most accurate forecast from the Forecasters' Club of New York. From 1990 to 1992 he was President of the New York Association for Business Economists. Mr. Moeller earned an M.B.A. in Finance from Fordham University, where he graduated in 1987. He holds a Bachelor of Arts in Economics from George Washington University.
More Economy in Brief


