 Global| Mar 16 2005
U.S. Current Account Deficit Another Record
by:Tom Moeller
|in:Economy in Brief
Summary
The US current account deficit deepened in 4Q04 to a record $187.9B. Consensus expectations had been for a deficit of $183.0B. The figure pulled the full year deficit to $665.9B, 5.7% of GDP. The deficit in merchandise trade [...]
The US current account deficit deepened in 4Q04 to a record $187.9B. Consensus expectations had been for a deficit of $183.0B. The figure pulled the full year deficit to $665.9B, 5.7% of GDP.
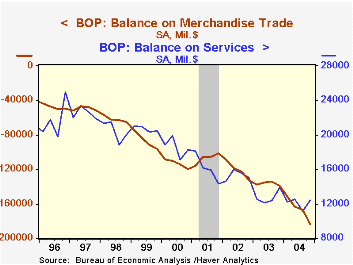
The deficit in merchandise trade deteriorated to $183.5B from a revised $167.0B in 3Q. Import growth of 5.4% (20.2% y/y) easily surpassed the strength of exports which grew 1.7% (11.6% y/y).
The surplus on services improved slightly to $12.5B from $11.2B in 3Q. The annual surplus of $48.4B in services trade was, however, barely half the peak in 1997 of $89.9B. Exports of services grew 2.6% in 4Q (7.2% y/y and imports rose 1.2% (10.9% y/y).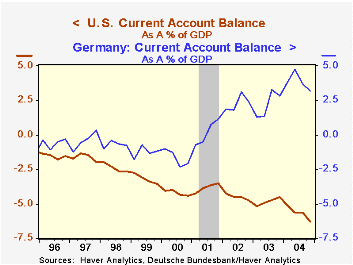
From the capital account, US foreign direct investment abroad surged to $101.3B, nearly double the 4Q03 level, and foreign direct investment in the US rose 1.3% to $36.3B, more than triple the 4Q03 level. The deficit of $65B pulled the full year deficit to $133B, about the same as during 2003.
Federal Reserve Board Governor Ben S. Bernanke's speech titled The Global Saving Glut and the U.S. Current Account Deficit can be found here.
| US Int'l Balance of Payments | 4Q '04 | 3Q '04 | Y/Y | 2004 | 2003 | 2002 |
|---|---|---|---|---|---|---|
| Current Account Deficit | $187.9B | $165.9B | $127.0B | $665.9B | $530.7B | $473.9B |
| Goods/Services/Income Deficit | $168.9B | $151.0B | $109.3B | $593.0B | $463.2B | $414.6B |
| Exports | 4.6% | 2.7% | 13.6% | 15.3% | 5.8% | -3.9% |
| Imports | 6.6% | 2.8% | 23.3% | 18.6% | 7.3% | 1.5% |
| Unilateral Transfers Deficit | $19.0B | $14.9B | $17.6B | $72.9B | $67.4B | $59.4B |
by Tom Moeller March 16, 2005
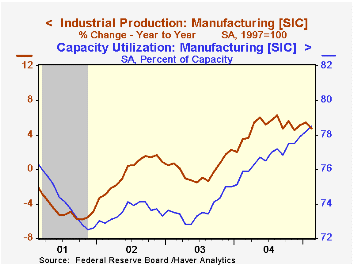
Industrial production rose 0.3% in February following an upwardly revised 0.1% up tick in January. Consensus expectations had been for a 0.4% increase. For the second month utility output fell, by 1.0% after the 2.8% decline in January.
Factory sector output rose 0.5% (4.7% y/y) for the third straight month. High tech sector output rose 1.5% (20.6% y/y) after a 3.2% January increase which was double the initial estimate. Output of communications equipment rose 2.4% (18.6% y/y). Factory output excluding high tech rose 0.5% (3.7% y/y), the strongest monthly gain since October.
Motor vehicle & parts output led the strength last month outside of tech and rose 5.2% (4.5% y/y). Excluding motor vehicles factory output rose just 0.1% (4.7% y/y).
Excluding both high tech and motor vehicles factory output was unchanged last month (3.7% y/y). Output in most industry groups declined. Clothing output fell 1.5% (-7.5% y/y) and paper output slipped 0.2% (+3.5% y/y). Machinery output fell 0.6% (+6.2% y/y) after a strong gain in January but production of appliances, furniture & carpeting rose 0.4% (0.1% y/y).
Total capacity utilization fell slightly to 79.0%. Capacity grew 1.2% y/y.
| Production & Capacity | Feb | Jan | Y/Y | 2004 | 2003 | 2002 |
|---|---|---|---|---|---|---|
| Industrial Production | 0.3% | 0.1% | 3.5% | 4.1% | -0.0% | -0.3% |
| Capacity Utilization | 79.4% | 79.2% | 77.7% (02/04) | 78.1% | 75.5% | 75.3% |
by Tom Moeller March 16, 2005
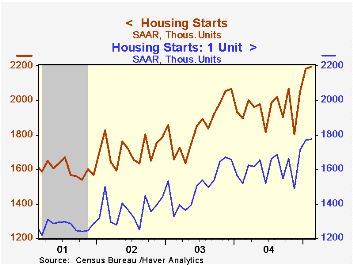
Housing starts unexpectedly ticked 0.5% higher in February to a record high of 2.195M following an upwardly revised 6.2% increase in January.Consensus expectations had been for a decline to 2.033M starts.
Single-family starts rose 0.3% m/m to a record high of 1.775M and reflected a 4.5% (19.0% y/y) gain in the Northeast. Single family starts in the Midwest also jumped 19.1% (7.3% y/y).
Multi family starts remained on the mend and rose 1.7% m/m after the upwardly revised 20.8% January spike.
Building permits slipped 2.7% reflecting a 10.8% (+13.8% y/y) drop in permits for 5+ units.
| Housing Starts (000s, AR) | Feb | Jan | Y/Y | 2004 | 2003 | 2002 |
|---|---|---|---|---|---|---|
| Total | 2,195 | 2,183 | 15.8% | 1,952 | 1,853 | 1,7 10 |
| Single-family | 1,775 | 1,770 | 16.7% | 1,605 | 1,505 | 1,363 |
| Multi-family | 420 | 413 | 12.3% | 347 | 348 | 347 |
| Building Permits | 2,074 | 2,132 | 6.0% | 2,035 | 1,8 89 | 1,749 |
by Tom Moeller March 16, 2005

The National Association of Home Builders' (NAHB) Composite Housing Market Index held at 69 in March versus an upwardly revised level in February.
Each of the index components held about at the February levels including the indexes of current and prospective sales which both were up solidly versus last last year.
During the last twenty years, annual changes in the composite index had an 83% correlation with the change in new home sales. There's been an 86% correlation with the change in single family housing starts.
The NAHB index is a diffusion index based on a survey of builders. Readings above 50 signal that more builders view conditions as good than poor.
Visit the National Association of Home Builders using this link.
| Nat'l Association of Home Builders | Mar | Feb | Mar '04 | 2004 | 2003 | 2002 |
|---|---|---|---|---|---|---|
| Composite Housing Market Index | 69 | 69 | 66 | 68 | 64 | 61 |
by Carol Stone March 16, 2005
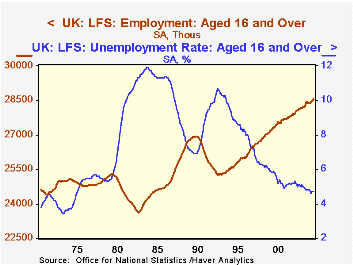
UK labor market data published today show further evidence of strength in the UK economy. The unemployment rate remained steady at 4.7% for the 3 months surrounding December (i.e., November, December and January), the lowest since the third quarter of 1975, nearly 30 years ago. The related "claimant count" was 813,300 in February, the lowest since June 1975.
Employment rose. The labor force measure, the number of people saying they have jobs, rose 46,000 to 28.57 million, a new high. This too is a 3-month centered moving average for December, compared to the November figure. The count of jobs in Q4 rose 126,000 to 30.53 million, reversing a dip in Q3.
Analysts today said they believe that the firm employment figures are not likely to prompt immediate monetary tightening by the Bank of England, since wage rates remained moderate. The average earnings index (AEI) for January (a 3-month moving average ending in January) was up 4.4% on a year ago, the same as the December figure. Despite some forecasts for a reduction to 4.2%, analysts based their expectation of steady monetary policy on a threshold of 4.5% that the Bank is said to use for consideration of interest rate increases.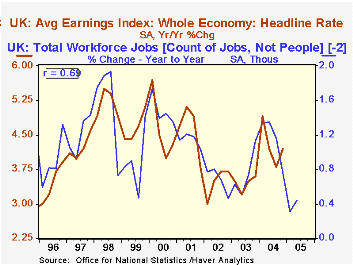
These wage rates and employment are linked, as seen in the second graph. Correlation over the last 10 years of the AEI with the year-on-year growth in workforce jobs has been positive and a notable 69% for the employment data with a two-quarter lead. Thus, as employment growth picks up, wages might be expected to accelerate some six months later; similarly, if employment growth slows, wage gains should diminish over time as well. This positive relationship with employment appearing to move ahead of wages suggests that the UK labor market is demand driven. A supply-oriented market would have wage movements leading employment.
| United Kingdom: All seasonally adjusted |
Feb 2005 | Jan 2005 | Dec 2005 | Nov 2005 | 2004 | 2003 | 2002 |
|---|---|---|---|---|---|---|---|
| Unemployment Rate (%) | 4.7* | 4.7* | 4.7 | 5.0 | 5.2 | ||
| Claimant Count (thous.) | 813 | 814 | 824 | 832 | 854 | 933 | 947 |
| Employment (mil.) | 28.57* | 28.52* | 28.44 | 28.18 | 27.91 | ||
| Change | +46K | +30K | +0.9% | +0.9% | +0.8% | ||
| Workforce Jobs | 30.53 (Q4) | 30.45 | 30.25 | 29.91 | |||
| Change | +126K vs. Q3 | +0.7 | +1.1 | +0.6 | |||
| Average Earnings Index "Headline Rate"** | 4.4 | 4.4 | 4.2 | 4.3 | 3.4 | 3.5 |

Tom Moeller
AuthorMore in Author Profile »Prior to joining Haver Analytics in 2000, Mr. Moeller worked as the Economist at Chancellor Capital Management from 1985 to 1999. There, he developed comprehensive economic forecasts and interpreted economic data for equity and fixed income portfolio managers. Also at Chancellor, Mr. Moeller worked as an equity analyst and was responsible for researching and rating companies in the economically sensitive automobile and housing industries for investment in Chancellor’s equity portfolio. Prior to joining Chancellor, Mr. Moeller was an Economist at Citibank from 1979 to 1984. He also analyzed pricing behavior in the metals industry for the Council on Wage and Price Stability in Washington, D.C. In 1999, Mr. Moeller received the award for most accurate forecast from the Forecasters' Club of New York. From 1990 to 1992 he was President of the New York Association for Business Economists. Mr. Moeller earned an M.B.A. in Finance from Fordham University, where he graduated in 1987. He holds a Bachelor of Arts in Economics from George Washington University.
More Economy in Brief


