 Global| Dec 11 2008
U.S. Credit Borrowing Fell Further During 3Q
by:Tom Moeller
|in:Economy in Brief
Summary
After the sharp decline during the second quarter, the U.S. household and business sectors pulled back their borrowing further during 3Q. It was only the Federal government that kept the credit houses in business. Nongovernment [...]
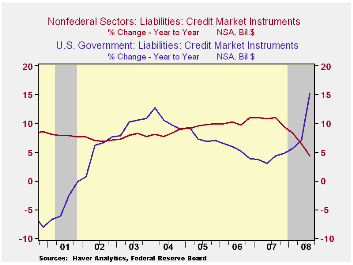
After the sharp decline during the second quarter, the U.S. household and business sectors pulled back their borrowing further during 3Q. It was only the Federal government that kept the credit houses in business. Nongovernment liabilities grew just 0.2% last quarter. A record low that pulled the y/y growth back to 4.3%, a rate not seen in fifteen years.
Borrowing by the household sector, like during 2Q, nearly evaporated as it posted a 0.1% uptick. Consumer credit did rise 1.4% (3.5% y/y) but that was offset by a 0.4% decline (+2.4% y/y) in mortgage borrowing. Households' obligations on home mortgages in fact declined by an unheard of $61B, or 0.5% (+1.2% y/y) after the $9B 2Q shortfall. Consumers' other credit liabilities rose $35B (3.5% y/y). Growth in bank loans remained fairly steady at 16% y/y).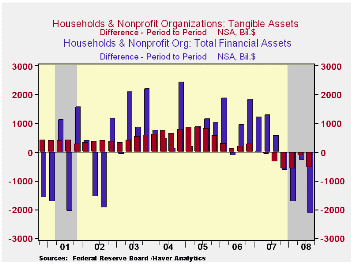
As economic recession developed and the war in the Middle East continued, the federal government's debt obligations surged an unprecedented $527B or by 15.3% y/y.
Credit market debt owed by the financial sector remained strong and steady at a 7% growth rate. Liabilities at commercial banks surged 23.4% y/y while savings institutions liabilities fell by 8.1%.
Asset price implosion also was in evidence in the 3Q figures. The value of equity market shares fell by nearly $1 trillion (-27.3% y/y) and mutual fund share values fell $597B or 17.5% y/y. Pension fund reserves additionally were hit to the tune of $600B or 12.5% y/y).
As a result of the implosion in equity market and home prices, the net worth of the U.S. household sector last quarter deteriorated by nearly three trillion dollars from the prior quarter's level. The dollar level of household sector financial assets fell $2.1 trillion (-9.6% y/y) and tangible asset values fell $0.5 trillion (-6.6% y/y).That pulled the net-wealth lost since the year-ago peak to $7.1 trillion, or 11.1%.
| Flow of Funds (Y/Y % Chg.) | % of Total | 3Q '08 | 2Q'08 | 2007 | 2006 | 2005 |
|---|---|---|---|---|---|---|
| Total Credit Market Debt Outstanding | -- | 6.2 | 7.6 | 10.1 | 9.9 | 9.2 |
| Federal Government | 11% | 15.3 | 7.0 | 4.9 | 3.9 | 7.0 |
| Households | 28% | 2.2 | 4.0 | 6.8 | 10.2 | 11.1 |
| Nonfinancial Corporate Business | 13% | 6.9 | 9.4 | 13.3 | 8.5 | 6.4 |
| Nonfarm, NonCorporate Business | 7% | 7.6 | 11.3 | 13.1 | 14.7 | 13.6 |
| Financial Sectors | 32% | 7.3 | 9.8 | 13.2 | 10.0 | 8.9 |
| Net Worth: Households & Nonprofit Organizations (Trillions) | -- | $56.540 | $59.354 | $62.170 | $61.591 | $57.385 |
| Tangible Assets: Households | -- | $25.842 | $26.381 | $27.092 | $28.061 | $27.125 |
| Financial Assets: Households | -- | $45.271 | $47.419 | $49.457 | $46.984 | $42.441 |

Tom Moeller
AuthorMore in Author Profile »Prior to joining Haver Analytics in 2000, Mr. Moeller worked as the Economist at Chancellor Capital Management from 1985 to 1999. There, he developed comprehensive economic forecasts and interpreted economic data for equity and fixed income portfolio managers. Also at Chancellor, Mr. Moeller worked as an equity analyst and was responsible for researching and rating companies in the economically sensitive automobile and housing industries for investment in Chancellor’s equity portfolio. Prior to joining Chancellor, Mr. Moeller was an Economist at Citibank from 1979 to 1984. He also analyzed pricing behavior in the metals industry for the Council on Wage and Price Stability in Washington, D.C. In 1999, Mr. Moeller received the award for most accurate forecast from the Forecasters' Club of New York. From 1990 to 1992 he was President of the New York Association for Business Economists. Mr. Moeller earned an M.B.A. in Finance from Fordham University, where he graduated in 1987. He holds a Bachelor of Arts in Economics from George Washington University.
More Economy in Brief


