 Global| Aug 14 2008
U.S. CPI Up 0.8% in July, Y/Y by 5.6%. Boost from Gasoline Prices Now Easing
by:Tom Moeller
|in:Economy in Brief
Summary
The consumer price index (CPI-U) for July rose 0.8%. That was down somewhat from the June increase of 1.1%, according to the Bureau of Labor Statistics, but the gain was double the Consensus expectation for a 0.4% rise. The Y/Y [...]
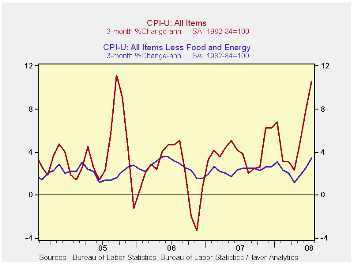
The consumer price index (CPI-U) for July rose 0.8%. That was down somewhat from the June increase of 1.1%, according to the Bureau of Labor Statistics, but the gain was double the Consensus expectation for a 0.4% rise. The Y/Y increase of 5.6% was the fastest since late 1990.
For June and July together, prices rose at an 11.8% annual rate. Except for a short-lived spike in mid-2005 that was the fastest rate of increase since 1982.
Energy prices jumped another 4.0% in July
after increases of 6.6% and 4.4% during the prior two months. Fuel oil
prices continued strong and posted a 1.3% (61.1% y/y) increase while
natural gas & electricity prices jumped 4.0% (15.0% y/y).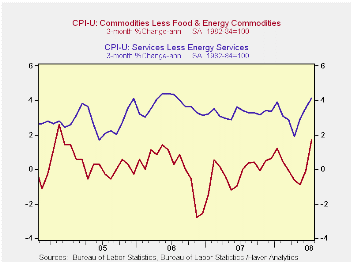
Gasoline prices jumped a seasonally adjusted 4.1% in July and they were up 37.9% y/y. Not seasonally adjusted gasoline prices, however, rose just 0.7% m/m last month and they are down 5.2% m/m on average so far in August.
Food & beverage prices continued
strong. A 0.9% July increase lifted the y/y gain to 5.8% and that was
the fastest since 1990. Prices for cereals & bakery products
rose at a 17.0% rate during the last three months while dairy and
related products increased at a 13.2% rate. Prices for meats poultry
& fish showed increased upward pressure and they rose at an
8.1% rate while dairy product prices surged at an 13.2% rate during the
last three months.
Less food & energy consumer prices beat expectations, slightly, with a 0.3% increase which matched the June rise. During the last three months the increase in core prices accelerated to a 3.5% annual rate which was the quickest since mid-2006.
Core goods prices jumped 0.5%, the fastest m/m increase since 1999. On a three-month basis prices rose at an accelerated 1.7% rate, the fastest since late 2004. Higher apparel prices led the recent strength with a 1.2% (0.7% y/y) increase. Prices for household furnishings & operations also were firm and they rose 0.4% (0.8% y/y). Prices for new & used motor vehicles nudged up 0.2% but they were down 0.3% year-to-year. In July, tobacco prices jumped 1.2% (7.7% y/y).
Core services prices again were firm and they rose 0.3%. That lifted the three-month growth rate to 4.1%, the fastest in two years. Public transportation prices remained strong. They posted a 1.1% July increase (14.5% y/y), rising at a 31.2% annual rate during the last three months. Medical care services prices rose a reduced 0.2% (4.1% y/y) and shelter prices also rose just 0.2% (2.5% y/y) in July. That was the weakest y/y gain since early 2006. Owners equivalent rent of primary residence, a measure not equivalent to other house price measures, nudged up 0.1% (2.6% y/y) and rents rose 0.3% (3.7% y/y). Education costs rose another 0.5% (5.7% y/y) after a 2.4% rise during all of 2007.
The chained CPI, which adjusts for shifts in consumption patterns, rose 0.4%. Less food and beverages chained prices rose 0.2%.
| Consumer Price Index (%) | July | June | Y/Y | 2007 | 2006 | 2005 |
|---|---|---|---|---|---|---|
| Total | 0.8 | 1.1 | 5.6 | 2.9 | 3.2 | 3.4 |
| Total less Food & Energy | 0.3 | 0.3 | 2.5 | 2.3 | 2.5 | 2.2 |
| Goods less Food & Energy | 0.5 | 0.1 | 0.6 | -0.4 | 0.2 | 0.5 |
| Services less Energy | 0.3 | 0.4 | 3.3 | 3.4 | 3.4 | 2.8 |
| Energy | 4.0 | 6.6 | 29.3 | 5.6 | 11.0 | 17.0 |
| Food & Beverages | 0.9 | 0.7 | 5.8 | 4.0 | 2.3 | 2.5 |
| Chained CPI: Total (NSA) | 0.4 | 0.8 | 4.8 | 2.5 | 2.9 | 2.9 |
| Total less Food & Energy | 0.2 | 0.1 | 2.2 | 2.0 | 2.2 | 1.9 |
by Tom Moeller August 14, 2008
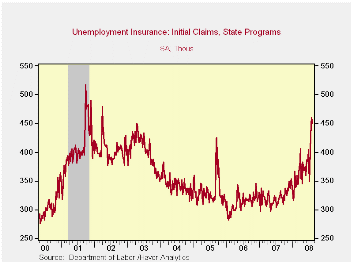
Initial claims for unemployment insurance dipped last week to 450,000 from an upwardly revised 460,000 during the prior week. The latest levels were the highest since March of 2002 and the most recent surpassed Consensus expectations for 432,000 claims.
A program to locate people eligible for jobless benefits may have continued to play a role in last week's elevated level of claims.
The four-week moving average increased to 440,500 (39.6% y/y),
the highest level since near the end of the 2001 recession 2001. During
July claims averaged 383,440.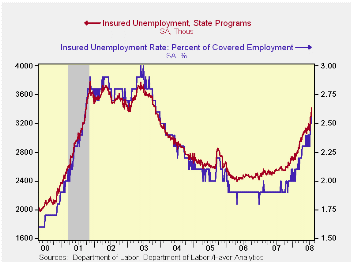
A claims level below 400,000 typically has been associated with growth in nonfarm payrolls. During the last ten years there has been a (negative) 76% correlation between the level of initial claims and the m/m change in nonfarm payroll employment. Over the longer period of time, the level of claims for jobless insurance has not trended higher with the size of the labor force due to a higher proportion of self-employed workers who are not eligible for benefits.
Continuing claims for unemployment insurance during the latest week jumped 114,000 after a little revised 25,000 rise during the prior week. The four-week moving average of continuing claims rose to 3,273,750 which was its highest level since late-2003.
Continuing claims provide some indication of workers' ability to find employment and they lag the initial claims figures by one week.
The insured rate of unemployment rose further to 2.6%, the highest level since late-2003.
Thoughts About the Phillips Curve is a paper presented by Paul A. Samuelson and it is available here.
| Unemployment Insurance (000s) | 08/09/08 | 08/02/08 | Y/Y | 2007 | 2006 | 2005 |
|---|---|---|---|---|---|---|
| Initial Claims | 450 | 460 | 39.3% | 322 | 313 | 331 |
| Continuing Claims | -- | 3,417 | 33.7% | 2,552 | 2,459 | 2,662 |
by Robert Brusca August 14, 2008
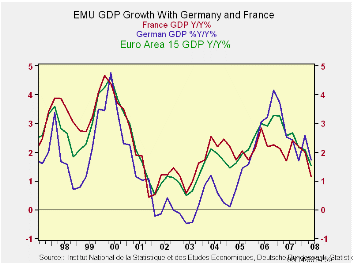
EMU GDP fell in 2008 Q2the first time since EMU-wide GDP data
have been collected. Declines were experienced across the main EMU
nations. Yr/Yr EMU growth is still 1.5% Italy’s growth is flat
year/year. Germany is still at 1.7% Yr/Yr. This was the first
quarter-on-quarter decline in EMU GDP since well before the euro was
launched in 1998. Eurostat has constructed a series for the 15 current
members of the euro zone that goes back to the start of 1995. The
weakest performance on record for that period had been the stagnant
second quarter of 2003. That now has been surpassed.
Q2 was not a good one for the global economy with most of the
major economies showing Q/Q declines in GDP – the US and UK are
exceptions. The Bundesbank put out a statement warning Germans not to
get too pessimistic about growth: "The German economy has got to get
through a rough patch for growth in the coming months. But overall
there's no reason for excessive pessimism based on the development of
the first half of the year," the German central bank said in a
statement. Still the data are clear and the industrial trends still
point lower. EMU inflation was revised to be one tenth of one percent
less in July to 4% Yr/Yr. Still it si double the allowable ceiling for
the ECB.
| E-Zone and main G-10 country GDP Results | |||||||
|---|---|---|---|---|---|---|---|
| Quarter over quarter-Saar | Year/Year | ||||||
| GDP | Q2-08 | Q1-08 | Q4-07 | Q2-08 | Q1-08 | Q4-07 | Q3-07 |
| EMU-15 | -0.8% | 2.9% | 1.5% | 1.5% | 2.1% | 2.2% | 2.7% |
| France | -1.2% | 1.6% | 1.5% | 1.1% | 2.0% | 2.2% | 2.4% |
| Germany | -2.0% | 5.2% | 1.4% | 1.7% | 2.6% | 1.7% | 2.4% |
| Italy | -1.1% | 2.0% | -1.7% | 0.0% | 0.3% | 0.2% | 1.6% |
| The Netherlands | -0.2% | 1.5% | 5.2% | 2.8% | 3.7% | 4.1% | 3.5% |
| UK | 0.7% | 1.1% | 2.5% | 1.6% | 2.3% | 2.8% | 3.0% |
| US | 1.9% | 0.9% | -0.2% | 1.8% | 2.5% | 2.3% | 2.8% |
| Japan | -2.4% | 3.2% | 2.4% | 1.0% | 1.2% | 1.4% | 1.8% |

Tom Moeller
AuthorMore in Author Profile »Prior to joining Haver Analytics in 2000, Mr. Moeller worked as the Economist at Chancellor Capital Management from 1985 to 1999. There, he developed comprehensive economic forecasts and interpreted economic data for equity and fixed income portfolio managers. Also at Chancellor, Mr. Moeller worked as an equity analyst and was responsible for researching and rating companies in the economically sensitive automobile and housing industries for investment in Chancellor’s equity portfolio. Prior to joining Chancellor, Mr. Moeller was an Economist at Citibank from 1979 to 1984. He also analyzed pricing behavior in the metals industry for the Council on Wage and Price Stability in Washington, D.C. In 1999, Mr. Moeller received the award for most accurate forecast from the Forecasters' Club of New York. From 1990 to 1992 he was President of the New York Association for Business Economists. Mr. Moeller earned an M.B.A. in Finance from Fordham University, where he graduated in 1987. He holds a Bachelor of Arts in Economics from George Washington University.
More Economy in Brief


