 Global| Feb 20 2008
U.S. CPI Total Stable, Core Strongest Since 2006
by:Tom Moeller
|in:Economy in Brief
Summary
The consumer price index (CPI-U) rose 0.4% last month, the same as during an upwardly revised December increase. (New seasonal factors were introduced for the last three years.) The latest increase was slightly ahead of expectations [...]
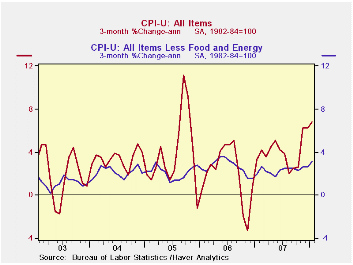
The consumer price index (CPI-U) rose 0.4% last month, the same as during an upwardly revised December increase. (New seasonal factors were introduced for the last three years.) The latest increase was slightly ahead of expectations for a 0.3% rise. It also lifted the y/y comparison to its fastest since October 2005.
Less food & energy, consumer prices rose 0.3% in January. That also was ahead of expectations for a 0.2% gain and it was the quickest since June of 2006. A Comparison of Measures of Core Inflation from the Federal Reserve Bank of New York can be found here.
A faster 0.7% gain in food & beverage prices
was the strongest since early last year. Prices for meats poultry
& fish surged 0.8% (5.4% y/y) and prices for fruits &
vegetables jumped 2.2% (6.2% y/y). Cereal & bakery product
prices also have been quite strong and posted a 0.6% gain (5.7% y/y).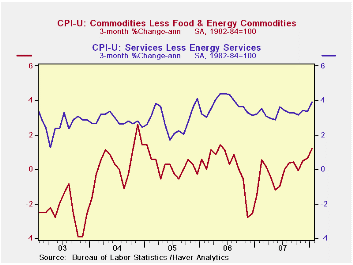
Core services prices rose 0.4% (3.4% y/y) and that was the fastest m/m rise since 2006. Shelter prices rose the same 0.3% (3.1% y/y) as during the prior two months. Owners equivalent rent of primary residence, a measure not equivalent to other house price measures, also rose 0.3% (2.8% y/y). Medical care services prices, however, were strong. The 0.6% increase doubled the December (5.7% y/y) rise. Tuition costs also posted a strong 0.6% (5.7% y/y) rise but the increase in public transportation prices cooled to 0.4% (5.8% y/y).
Core goods prices rose 0.2% and that was the fastest increase since early 2006. It mainly reflected a 0.4% rise in apparel prices that still left them down 0.2% y/y. Medical care commodity prices also were strong and rose 0.5% (2.5% y/y) but most other goods price increases were tame. Prices for new & used motor vehicles fell 0.1% (0.0% y/y) during January and prices of household furnishings & operation ticked up 0.1% (-0.5% y/y) after two months of having been unchanged.
Energy prices rose just 0.7% last month, well off the double digit rates of increase during the prior four months. The gain in gasoline prices eased to only 1.2% (34.5% y/y) and the weekly data already show a slight m/m decline this month. Prices for fuel oil & other fuels, however, were quite strong and rose 3.7% (34.7% y/y) but natural gas & electricity prices fell 0.5% (+3.% y/y).
The chained CPI, which adjusts for shifts in the mix of consumer purchases rose 0.5% (+3.9% y/y) and the core measure rose 0.3%, its fastest gain since October. This latter measure is similar to the core PCE price index but its treatment of housing price differs
Publishing Central Bank Interest Rate Forecasts from the Federal Reserve Bank of San Francisco can be found here.
| Consumer Price Index | January | December | November | Jan Y/Y | 2007 | 2006 | 2005 |
|---|---|---|---|---|---|---|---|
| Total | 0.4% | 0.4% | 0.9% | 4.4% | 2.9% | 3.2% | 3.4% |
| Total less Food & Energy | 0.3% | 0.2% | 0.2% | 2.5% | 2.3% | 2.5% | 2.2% |
| Goods less Food & Energy | 0.2% | 0.0% | 0.1% | 0.2% | -0.4% | 0.2% | 0.5% |
| Services less Energy | 0.4% | 0.3% | 0.3% | 3.4% | 3.4% | 3.4% | 2.8% |
| Energy | 0.7% | 1.7% | 6.9% | 20.4% | 5.6% | 11.0% | 17.0% |
| Food & Beverages | 0.7% | 0.1% | 0.4% | 4.9% | 4.0% | 2.3% | 2.5% |
| Chained CPI: Total (NSA) | 0.5% | -0.1% | 0.5% | 3.9% | 2.5% | 2.9% | 2.9% |
| Total less Food & Energy | 0.3% | -0.1% | 0.0% | 2.2% | 2.0% | 2.2% | 1.9% |
by Tom Moeller February 20, 2008
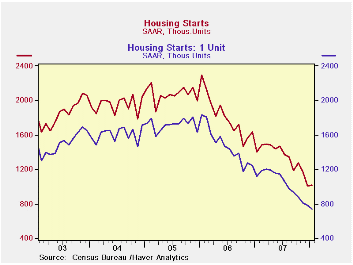
Housing starts last month did rise slightly as expected to 1.012M units, up 0.8% from December. But the gain did little to dent m/m declines of 14.8% in December and 7.5% during November. As a result housing starts remained near the lows of 1991.
Last month, all of the increase in the total was due to a 22.3% gain in starts of condos & coops.
Single family starts in January fell 5.2% after like declines
during each of the prior six months. The decline to .743M was to the
lowest level since January 1991. Since the peak in early
2006, starts of single family homes are down 59.6%.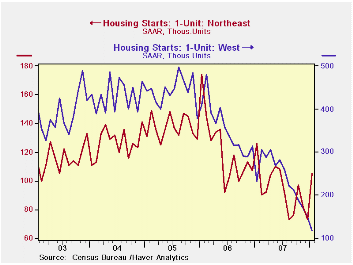
By region, single family starts in the Northeast rose by nearly one half m/m to the highest level since last June. That rise was countered by a 20.3% (-49.1% y/y) decline in the West. Single family starts in the Midwest were stable m/m (-31.1% y/y) and in the South, single family starts fell 9.8% (-32.3% y/y).
Building permits fell 3.0% (-35.1% y/y). Single-family permits fell 4.1% (-40.3% y/y).
Liquidity, Monetary Policy, and Financial Cycles from the Federal Reserve Bank of New York is available here.
| Housing Starts (000s, AR) | January | December | Y/Y | 2007 | 2006 | 2005 |
|---|---|---|---|---|---|---|
| Total | 1,012 | 1,004 | -27.9% | 1,344 | 1,812 | 2,073 |
| Single-Family | 743 | 784 | -33.8% | 1,039 | 1,474 | 1,719 |
| Multi-Family | 269 | 220 | -3.9% | 304 | 338 | 354 |
| Building Permits | 1,048 | 1,080 | -33.1% | 1,371 | 1,842 | 2,159 |
by Robert Brusca February 20, 2008

French and Italian orders have shown some consistency in recent years in their oscillations. Currently Italy’s trends are a bit flatter and the French trends are still a bit stronger but both saw clear evidence of losing momentum as 2008 approaches.
Over the last three months Italy’s orders are off at a 13.1% pace; French orders are off at a 0.3% pace for the same period. Italy’s foreign orders are off over 12, 6 and 3 months and are showing progressively worse results. French foreign orders are up weakly over 12 months and are lower over 6 months but have made a minor rebound in the recent three months. So while French foreign order trends are better than Italian trends they are still not solid…For the fourth quarter, French orders are dropping at a 3.8% pace Q/Q while Italy’s orders are dropping at a 3.3% annual pace. France’s foreign orders are holding up better with a mere 4% drop annualized in Q4 compared to Italy where the annual rate of decline for foreign orders is 15%.
The Euro Area is now showing some signs of growth erosion and we cannot tell if it is the strong euro at work or the effects of financial distress and lowered expectations that are having the largest impact. But France and Italy are showing signs of wear on tear in their respective industrial sectors.
| Italy Orders | ||||||
|---|---|---|---|---|---|---|
| Saar exept m/m | Dec-07 | Nov-07 | Oct-07 | 3-mo | 6-mo | 12-mo |
| Total | -5.4% | 2.9% | -1.1% | -14.1% | -8.8% | 1.6% |
| Foreign | -8.1% | 3.9% | -5.8% | -34.6% | -23.1% | -0.6% |
| Domestic | -4.1% | 2.5% | 1.5% | -0.7% | 0.2% | 2.7% |
| Memo | ||||||
| Sales | -2.7% | 0.2% | -0.7% | -12.0% | -4.0% | -2.8% |
| French Orders | ||||||
| Saar exept m/m | Dec-07 | Nov-07 | Oct-07 | 3-mo | 6-mo | 12-mo |
| Total | -2.0% | -0.3% | 2.2% | -0.3% | -7.0% | 3.8% |
| Foreign | -1.0% | 1.1% | 0.5% | 2.5% | -9.3% | 3.5% |
by Robert Brusca February 20, 2008
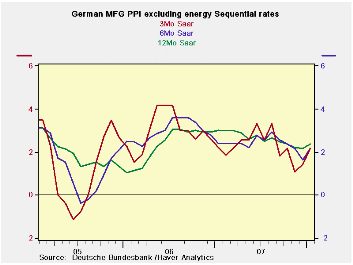
The German inflation picture remains a bit hotter than the ECB would have liked. With headline PPI inflation up by 0.7% the core was up by 0.4%. Over the past 12 months, headline MFG inflation is at 3.2% the same as it was a year ago. Excluding energy MFG inflation fell to 2.4% Yr/Yr from 3% a year ago.
Sequential growth rates show that ex energy inflation is very sticky above 2%. Meanwhile, headline inflation has continued to build pressures in terms of these sequential rates.
Basic goods prices rose by 0.7% in January and by 2.6% Yr/Yr. Capital goods prices rose by 0.1% and are higher Yr/Yr by 0.7%. Consumer goods prices rose by 0.5% in January but were up a strong 3.9% Yr/Yr. Energy prices were by 2.1% in January and by 5.9% Yr/Yr.
| Germany PPI | |||||||
|---|---|---|---|---|---|---|---|
| %m/m | %-SAAR | ||||||
| Jan-08 | Dec-07 | Nov-07 | 3-mo | 6-mo | 12-mo | 12-mo Year Ago | |
| MFG | 0.7% | 0.0% | 0.9% | 6.9% | 4.6% | 3.2% | 3.2% |
| Ex Energy | 0.4% | 0.1% | 0.1% | 2.2% | 2.2% | 2.4% | 3.0% |
by Robert Brusca February 20, 2008
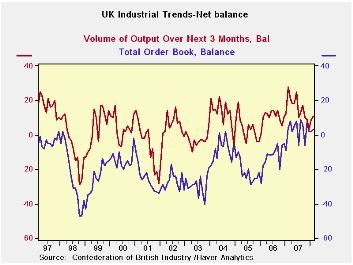
The UK’s CBI report is a survey which reports purchaser type
survey data as net measures (net better Vs worse responses). The report
shows that output trends, while still showing expansion, have moved
substantially lower. Order trends have been hovering; they show small
net positive readings. This month the order series even ticked higher
to a net +3 from +2 in January. Output volume expected in the next
three months has improved a bit too. At +11 in February it is up from
+9 in January and +3 in December. Still, it is a reading that is still
below its 12-month average of 14. But prices are the real headline of
this report. Price pressures continue to rise. At +22 they are
accelerating and are above their 12-month average of 18. Prices for the
next 3 months stand in the 95th percentile of their range. This is
stronger than for orders or export orders where the rankings show them
in the top 79th to 88th percentile of their ranges. Output is only in
the top 30% of its range. While the BOE is cutting rates the output and
orders barometers in this report are still firm but price expectations
are pushing their limits.
| UK Industrial Volume Data CBI Survey | |||||||||
|---|---|---|---|---|---|---|---|---|---|
| Reported: | Jan-08 | Dec-07 | Nov-07 | Oct-07 | 12-mo Avg | Pcntle | Max | Min | Range |
| Total Orders | 2 | 2 | 8 | -6 | 4 | 86% | 9 | -40 | 49 |
| Export Orders | -4 | 2 | -4 | -9 | -3 | 87% | 3 | -50 | 53 |
| Stocks: Final Goods | 7 | 14 | 14 | 14 | 9 | 32% | 26 | -2 | 28 |
| Output Volume: Next 3M | 9 | 3 | 9 | 10 | 15 | 66% | 28 | -28 | 56 |
| Averages Prices for Next 3M | 21 | 15 | 21 | 14 | 18 | 93% | 25 | -30 | 55 |
| From end 2000 | |||||||||

Tom Moeller
AuthorMore in Author Profile »Prior to joining Haver Analytics in 2000, Mr. Moeller worked as the Economist at Chancellor Capital Management from 1985 to 1999. There, he developed comprehensive economic forecasts and interpreted economic data for equity and fixed income portfolio managers. Also at Chancellor, Mr. Moeller worked as an equity analyst and was responsible for researching and rating companies in the economically sensitive automobile and housing industries for investment in Chancellor’s equity portfolio. Prior to joining Chancellor, Mr. Moeller was an Economist at Citibank from 1979 to 1984. He also analyzed pricing behavior in the metals industry for the Council on Wage and Price Stability in Washington, D.C. In 1999, Mr. Moeller received the award for most accurate forecast from the Forecasters' Club of New York. From 1990 to 1992 he was President of the New York Association for Business Economists. Mr. Moeller earned an M.B.A. in Finance from Fordham University, where he graduated in 1987. He holds a Bachelor of Arts in Economics from George Washington University.
More Economy in Brief


