 Global| Apr 16 2008
U.S. CPI Total Rose An Expected 0.3%
by:Tom Moeller
|in:Economy in Brief
Summary
During March, the consumer price index (CPI-U) rose an expected 0.3% after having been unchanged in February. Less food & energy, consumer prices rose 0.2% and that also was as expected. A Comparison of Measures of Core Inflation from [...]
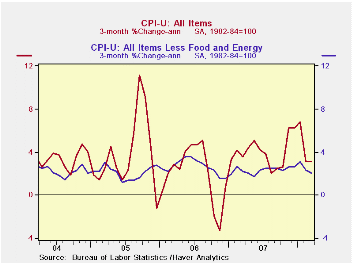
During March, the consumer price index (CPI-U) rose an expected 0.3% after having been unchanged in February. Less food & energy, consumer prices rose 0.2% and that also was as expected. A Comparison of Measures of Core Inflation from the Federal Reserve Bank of New York can be found here.
Energy prices were quite firm last month
and they rose 1.9% overall, the strongest increase since last November.
Fuel oil prices led the strength with a 7.9% (40.2% y/y) rise while
natural gas & electricity prices also were strong. They rose
1.9% (4.1% y/y). Gasoline prices increased 1.3% (26.0% y/y) and in
April already have increased another 3.6%.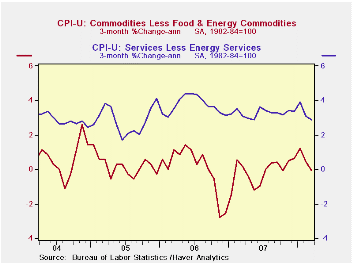
Inflation of food & beverage prices remained moderate at 0.2% due to continued softness in prices for meats, poultry & fish which were unchanged m/m (3.7% y/y). That followed a slight decline in February. Conversely, prices for cereal & bakery products remained strong and rose 1.3% (8.1% y/y). Earlier strength in dairy products took a breather m/m and they fell 0.8% (+11.0% y/y).
Core goods prices posted the second consecutive 0.1% m/m decline. Apparel prices fell 1.3% (-1.3% y/y) but prices for household furnishings & operations rose 0.5% (-0.2% y/y). March prices for new & used motor vehicles fell 0.1% (-0.0% y/y).
Core services prices increased 0.2% as shelter prices, which constitute 33% of the total CPI, rose just 0.1% (2.9% y/y) after having been unchanged in February. Owners equivalent rent of primary residence, a measure not equivalent to other house price measures, rose 0.2% (2.6% y/y). Medical care services prices ticked up 0.1% (4.8% y/y) for the second straight month. Tuition costs rose 0.4% and the annual rate of gain has been fairly stable at 5.5% y/y. Another source of price strength, however, has been for public transportation where prices surged 2.5% (7.5% y/y).
Stable Prices, Stable Economy: Keeping Inflation in Check Must be No. 1 Goal of Monetary Policymakers from the Federal Reserve bank of St. Louis is available here.
| Consumer Price Index (%) | March | February | January | March Y/Y | 2007 | 2006 | 2005 |
|---|---|---|---|---|---|---|---|
| Total | 0.3 | 0.0 | 0.4 | 4.0 | 2.9 | 3.2 | 3.4 |
| Total less Food & Energy | 0.2 | 0.0 | 0.3 | 2.4 | 2.3 | 2.5 | 2.2 |
| Goods less Food & Energy | -0.1 | -0.1 | 0.2 | 0.0 | -0.4 | 0.2 | 0.5 |
| Services less Energy | 0.2 | 0.1 | 0.4 | 3.3 | 3.4 | 3.4 | 2.8 |
| Energy | 1.9 | -0.5 | 0.7 | 17.0 | 5.6 | 11.0 | 17.0 |
| Food & Beverages | 0.2 | 0.4 | 0.7 | 4.4 | 4.0 | 2.3 | 2.5 |
| Chained CPI: Total (NSA) | 0.8 | 0.3 | 0.5 | 3.6 | 2.5 | 2.9 | 2.9 |
| Total less Food & Energy | 0.5 | 0.3 | 0.3 | 2.1 | 2.0 | 2.2 | 1.9 |
by Tom Moeller April 16, 2008
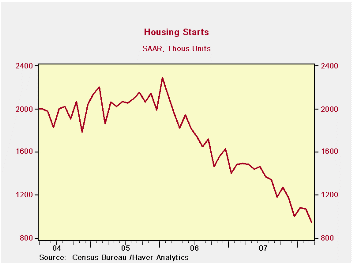
During March, housing starts were weaker than expected, falling 11.9% m/m to 947,000 units. A decline to 1.010M had been generally expected. The latest level was the lowest since early 1991.
Accentuating the total's m/m decline was a 24.6% drop in
starts of multi-family units which more than reversed February's 11.7%
rise. 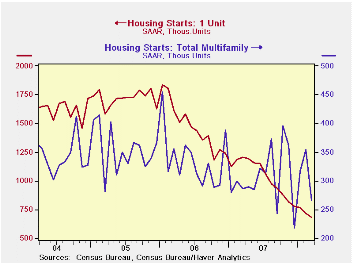
Single family starts last month fell by about the same 5.7% as they did in February. That month's decline was revised slightly shallower. Single family starts in March also were at their lowest level since early 1991 and they have fallen 63.0% since their early 2006 peak. For 1Q08, starts fell 12.6% from 4Q07.
By region, in the Midwest single family starts fell to a record low and were down 25.0% y/y. Single family starts in the Northeast were roughly unchanged m/m but were down 30.4% y/y. In the South, single family starts also were about unchanged (-40.9% y/y) and in the West single family starts fell 11.8%. (-48.3% y/y). That decline reversed much of the surge in February and they remained down 70% from the August 2005 peak.
Building permits fell 5.8% m/m and single-family permits fell 6.2% (-46.4% y/y).
Understanding the Securitization of Subprime Mortgage Credit from the Federal Reserve Bank of New York can be found here.
| Housing Starts (000s, AR) | March | February | Y/Y | 2007 | 2006 | 2005 |
|---|---|---|---|---|---|---|
| Total | 947 | 1,075 | -36.5% | 1,344 | 1,812 | 2,073 |
| Single-Family | 680 | 721 | -43.6% | 1,039 | 1,474 | 1,719 |
| Multi-Family | 267 | 354 | -6.6% | 304 | 338 | 354 |
| Building Permits | 927 | 984 | -40.9% | 1,371 | 1,842 | 2,159 |
by Tom Moeller April 16, 2008
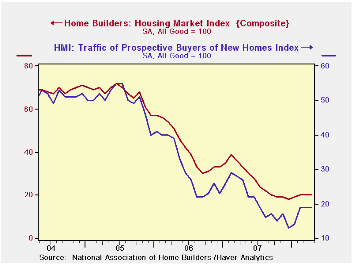
The National Association of Home Builders' (NAHB) reported that its April Composite Housing Market Index remained stable with the prior two months and at about the same level where it's been since September. Nevertheless, these levels are more than two-thirds lower than the highs of 2004.
During the last twenty years there has been a 76% correlation between the y/y change in the Composite Index and the change in single family housing starts.
The index for single family detached homes also remained near the cycle's low which was down about three quarters from the 2004 high. Builders saw a modest improvement in single family home sales during the next six months.
The Home Builders' index remained low and stable throughout the countries' regions.
Traffic of prospective home buyers was stable for the second month at a level which was up somewhat from the recent low.
The NAHB index is a diffusion index based on a survey of builders. Readings above 50 signal that more builders view conditions good than poor.
Visit the National Association of Home Builders.
| Nat'l Association of Home Builders | April | March | April '07 | 2007 | 2006 | 2005 |
|---|---|---|---|---|---|---|
| Composite Housing Market Index | 20 | 20 | 33 | 27 | 42 | 67 |
by Tom Moeller April 16, 2008
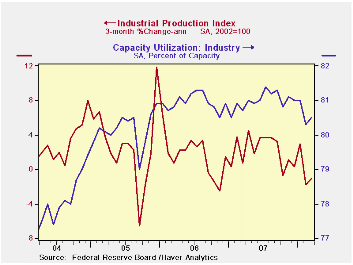
Industrial production last month rose 0.3% after a 0.7% February decline which was deeper than reported initially. Also revised down was production growth last year and during 2006. A 0.1% decline in March output had been the Consensus expectation.
Factory output ticked up 0.1% in March after falling by a
downwardly revised 0.5% in February. The three month change in output,
however, fell to a negative 1.4% (AR). Production in the high tech
sector has been strong and rose 1.3% (13.1% y/y), as it did in
February. Outside the high tech sector, factory output fell 0.1% and a
February decline was revised deeper to -0.7%. Three month output growth
in manufacturing output less high tech fell to -2.8% (AR) but appliance
production rose 5.0% last month.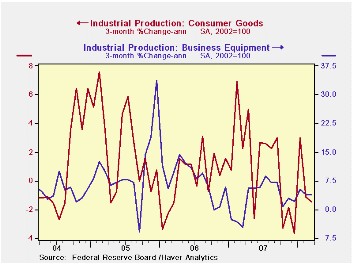
Production of computers & electronics surged again last month by 2.6% and three month growth totaled 20.3% (AR).
Weakness elsewhere in the durable goods area continued intense. Output of furniture & appliances is down at a 10.5% rate during the last three months while production of automotive products has fallen at a 29.0% rate. Auto output is down partially due to the workers' strike at the American Axel Company. Machinery production is off at a 1.2% rate and metals output turned negative. In the nondurables sector apparel product output has fallen at a 10.8% rate over the last three months.
Output of business equipment increased 0.6% after no change in February. Output of industrial equipment less high tech recovered 0.7% after a 0.2% February slip. The three month growth rate improved to 3.9%.
Capacity utilization rose slightly to 80.5% during March but utilization in the factory sector slipped to 78.5%, its lowest also since late 2005. Annual growth in capacity is growing 1.8% y/y and at 2.1% in the factory sector. Less high tech, capacity growth is a lower 0.9% y/y.
| INDUSTRIAL PRODUCTION (SA) | March | February | Y/Y | 2007 | 2006 | 2005 |
|---|---|---|---|---|---|---|
| Total | 0.3 | -0.7 | 1.5 | 1.7 | 2.2 | 3.3 |
| Manufacturing | 0.1 | -0.5 | 1.2 | 1.7 | 2.4 | 4.0 |
| Utilities | 1.9 | -3.6 | 2.3 | 3.3 | -0.6 | 2.1 |
by Robert Brusca April 16, 2008
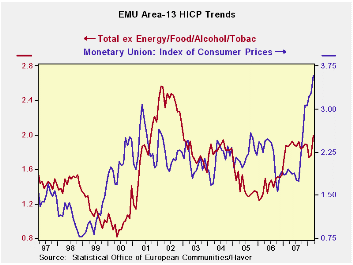
Euro Area inflation was revised higher in March and now is
expanding at a 3.6% annual rate, not quite as fast as the universe, but
fast enough to create a gnashing of teeth at the ECB. Yesterday,
Juergen Stark of the ECB said that current policy may not be enough to
hold medium term prices stability in line. Among the four largest EMU
economies, core inflation is over the 2% inflation ceiling, ranging
from a 2.4% yr/yr pace in Germany to a 3.5% pace in Spain. France an
Italy are seeing their respective core inflation rates accelerated from
12 months, to 6 months to, 3 months. Now those are not good trends at
all. Germany’s core inflation acceleration broke off from six months to
three months, as the three month rate has dropped back to 1.9%. In
Spain the three month rate fell back to 3.1% from 4.2% over six months.
Within EMU as a whole core inflation is still accelerating,
with the 3-month pace up to 3.4%.
| Trends in HICP | |||||||
|---|---|---|---|---|---|---|---|
| % mo/mo | % saar | ||||||
| Mar-08 | Feb-08 | Jan-08 | 3-Mo | 6-Mo | 12-Mo | Yr Ago | |
| EMU-13 | 0.5% | 0.3% | 0.3% | 4.1% | 4.8% | 3.6% | 2.0% |
| Core | 0.4% | 0.3% | 0.1% | 3.4% | 3.3% | 2.7% | 1.9% |
| Goods | 1.4% | 0.3% | -0.5% | 4.5% | 6.1% | 4.1% | 1.7% |
| Services | 0.4% | 0.5% | -0.2% | 2.8% | 3.0% | 2.8% | 2.4% |
| HICP | |||||||
| Germany | 0.4% | 0.3% | 0.3% | 3.8% | 3.9% | 3.3% | 2.1% |
| France | 0.5% | 0.0% | 0.3% | 3.5% | 4.8% | 3.5% | 1.2% |
| Italy | 0.6% | 0.6% | 0.1% | 5.0% | 5.2% | 3.6% | 2.1% |
| Spain | 0.4% | 0.4% | 0.2% | 4.1% | 6.2% | 4.6% | 2.5% |
| Core excl Food, Energy and Alcohol | |||||||
| Germany | 0.4% | 0.3% | -0.2% | 1.9% | 2.5% | 2.4% | 1.7% |
| France | 0.4% | 0.1% | 0.3% | 3.2% | 3.1% | 2.5% | 1.3% |
| Italy | 0.7% | 0.4% | 0.0% | 4.3% | 4.1% | 2.9% | 2.0% |
| Spain | 0.3% | 0.3% | 0.2% | 3.1% | 4.2% | 3.5% | 2.5% |

Tom Moeller
AuthorMore in Author Profile »Prior to joining Haver Analytics in 2000, Mr. Moeller worked as the Economist at Chancellor Capital Management from 1985 to 1999. There, he developed comprehensive economic forecasts and interpreted economic data for equity and fixed income portfolio managers. Also at Chancellor, Mr. Moeller worked as an equity analyst and was responsible for researching and rating companies in the economically sensitive automobile and housing industries for investment in Chancellor’s equity portfolio. Prior to joining Chancellor, Mr. Moeller was an Economist at Citibank from 1979 to 1984. He also analyzed pricing behavior in the metals industry for the Council on Wage and Price Stability in Washington, D.C. In 1999, Mr. Moeller received the award for most accurate forecast from the Forecasters' Club of New York. From 1990 to 1992 he was President of the New York Association for Business Economists. Mr. Moeller earned an M.B.A. in Finance from Fordham University, where he graduated in 1987. He holds a Bachelor of Arts in Economics from George Washington University.
More Economy in Brief


