Global| Nov 15 2007
U.S. CPI Rise of 0.3% As-expected, 0.2% Core Also In Line
by:Tom Moeller
|in:Economy in Brief
Summary
The consumer price index (CPI-U) rose an expected 0.3% last month and matched the prior month's swift increase. Rising to 3.5%, the y/y rise also was the quickest in just over one year. Core consumer price inflation held stable at an [...]
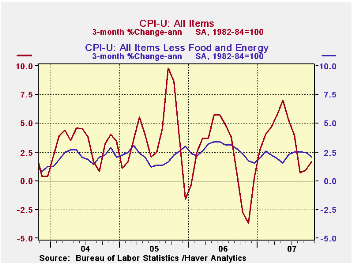
The consumer price index (CPI-U) rose an expected 0.3% last month and matched the prior month's swift increase. Rising to 3.5%, the y/y rise also was the quickest in just over one year.
Core consumer price inflation held stable at an expected 0.2% for the sixth month in the last seven. The y/y increase of 2.1% also was stable although the change over the last three months dipped to 2.1% (AR) from 2.5% where it has been since July.
Core goods prices dipped just slightly for
the third straight month as apparel prices showed no change (-1.2%
y/y). New & used motor vehicle prices also fell for the second
straight month (-1.1% y/y) and prices of household furnishings
& operation fell for the sixth month in the last seven (-0.9%
y/y).Tobacco prices provided lift to the core goods price measure with
a 0.2% (7.6% y/y) rise.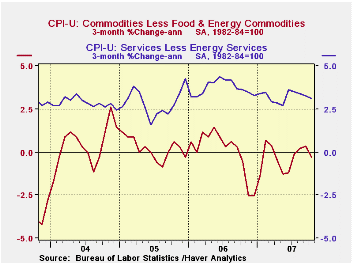
Core services prices rose 0.2% (3.2% y/y) but the gains have been decelerating since June, mostly because of slower gains in shelter prices. They rose 0.1% (3.3% y/y) but the three month change fell to 2.4%, half the rate of increase a year ago. The owners equivalent rent of primary residence, a measure not equivalent to other house price measures, rose 0.2% (2.8% y/y). Over the last three months, however, most of the deceleration in shelter prices has been due to prices for lodging away from home. Public transportation prices rose an accelerated 1.2% (2.6% y/y) while medical care services prices also rose an accelerated 0.6% (5.9% y/y). Education service prices rose 0.8% (5.3% y/y) but communication prices fell slightly (-0.4% y/y).
Food & beverage prices again
increased 0.3% (4.4% y/y). That y/y increase is double the rate of last
December. Prices for fruits & vegetable rose 0.7% (0.8% y/y)
but prices for meats, poultry & fish rose 0.2% (5.6% y/y).
Prices of dairy products rose a diminished 0.2% (2.8% y/y) after four
straight months of double digit gain.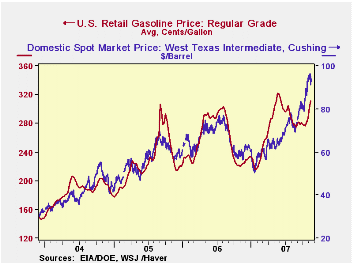
Energy prices were firm last month. The 1.4% gain was led by a 1.3% (5.0% y/y) rise in natural gas & electricity prices. Gasoline prices also jumped 1.4% (2.4% y/y) but the weekly data indicates a 9.2% m/m gain for November.
The chained CPI, which adjusts for shifts in the mix of consumer purchases rose 0.2% (3.0% y/y) but the core measure rose 0.2%, 1.8% y/y.
What's Really Happening in Housing Markets from the Federal Reserve Bank of Cleveland is available here.| Consumer Price Index | Oct | Sept | Aug | Y/Y | 2006 | 2005 | 2004 |
|---|---|---|---|---|---|---|---|
| Total | 0.3% | 0.3% | -0.1% | 3.5% | 3.2% | 3.4% | 2.7% |
| Total less Food & Energy | 0.2% | 0.2% | 0.2% | 2.1% | 2.5% | 2.2% | 1.8% |
| Goods less Food & Energy | -0.0% | -0.0% | -0.0% | -0.6% | 0.2% | 0.5% | -0.9% |
| Services less Energy | 0.2% | 0.3% | 0.2% | 3.2% | 3.4% | 2.8% | 2.8% |
| Energy | 1.4% | 0.3% | -3.2% | 14.5% | 11.1% | 16.9% | 10.8% |
| Food & Beverages | 0.3% | 0.5% | 0.4% | 4.4% | 2.3% | 2.4% | 3.4% |
| Chained CPI: Total (NSA) | 0.2% | 0.3% | -0.1% | 3.0% | 2.8% | 2.9% | 2.5% |
| Total less Food & Energy | 0.3% | 0.3% | 0.2% | 1.8% | 2.3% | 1.9% | 1.7% |
by Tom Moeller November 15, 2007
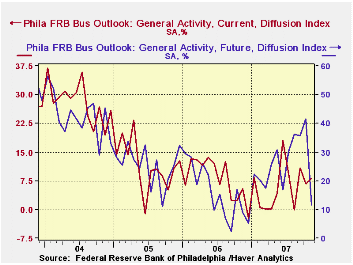
The November Philadelphia Federal Reserve Bank's Index of General Business Conditions in the manufacturing sector recovered just a piece of its October decline. The rise to 8.2 followed a sharp October decline to 6.8 from 10.9 in September.
The index is a diffusion index for each component or series. It reflects the increase in activity reported less the decrease.
During the last ten years there has been a 59% correlation between the level of the Philadelphia Fed Business Conditions Index and the three-month growth in factory sector industrial production. There has been a 42% correlation with q/q growth in real GDP.
The new orders index improved very slightly as a meaningful
gain in new orders was offset by a sharp rise in orders which had
decreased. The employment index fell sharply as the number of firms
reporting an increase fell sharply and the number of firms showing a
decrease rose. During the last ten years there has been a 75%
correlation between the employment index and the three-month growth in
factory payrolls.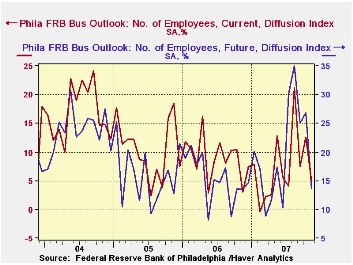
The business conditions index reflects a separate survey question, not the sub indexes.
The prices paid index slipped as the number of firms reporting an increase fell and the number reporting a decrease rose. During the last ten years there has been a 76% correlation between the prices paid index and the three-month growth in the intermediate goods PPI. There has been an 85% correlation with the change in core intermediate goods prices.
The separate index of expected business conditions in six months fell sharply to its lowest level since December of last year. Expectations for new orders plummeted as did expectations for the number of employees.
The latest Survey of Professional Forecasters from the Federal Reserve Bank of Philadelphia is available here.
| Philadelphia Fed Business Outlook | November | October | Nov. ‘06 | 2006 | 2005 | 2004 |
|---|---|---|---|---|---|---|
| General Activity Index | 8.2 | 6.8 | 5.4 | 8.1 | 11.5 | 28.1 |
| Prices Paid Index | 37.7 | 40.3 | 25.2 | 36.6 | 40.1 | 51.2 |
by Carol Stone November 15, 2007
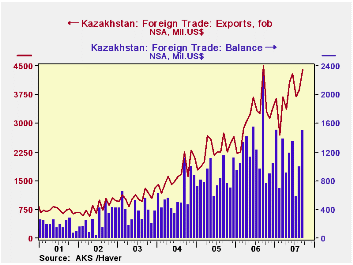
The Kazakhstani economy is growing rapidly, benefiting from strong oil revenues. New data on trade through September indicate a sizable surplus, owing much to oil and gas exports. Further, separate data on fixed capital investment show continuing strong growth in infrastructure spending and other capital projects.
The summary trade balance was reported about 10 days ago, with a surplus in September of $1.6 billion, up from $1.1 billion in August, but smaller than the $2.4 billion a year ago. The factor in the smaller surplus this year than last is a reduction in the value of oil exports from $3.1 billion in September 2006 to $2.6 billion this September, according to the detail data published today. Even so, other exports gained noticeably, and total exports were only very little different, $4.41 billion this September compared with $4.50 billion last year.
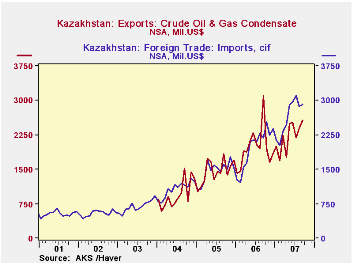
The slack was taken up by sizable gains in various metals and metal products. What the Kazakhs refer to as ferro-alloys and flat ferrous metals, along with lead and precious metals, all contributed. Rising world prices for steel scrap and lead, among others, are no doubt responsible. And while oil exports were down in the latest month, they remain generally quite large, bringing sizable quantities of dollars into the country. Note in the table below and the second graph, the uncanny match between the value of oil exports and total imports: oil revenue is very nearly covering Kazakhstan's demand for outside products.
This favorable natural resource trade situation is fueling (if you will) a prolonged building boom. Monthly data on "fixed capital investment" show sustained growth, running through October at 19% year-on-year. This is "slower" than in 2004-2006, but it remains vigorous. Of KZT245 million per month so far this year, about 30% has been in the oil and gas industry, a quarter in "real estate, renting and business activity" and about an eighth in transportation and communication infrastructure. By type of investment, just over half is in construction projects and just under a third is in machinery and tools.
Data on Kazakhstan are contained in Haver's EMERGECW database.
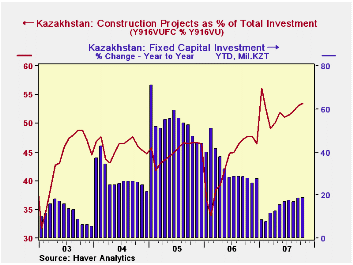
| Kazakhstan | Oct 2007 | Sept 2007 | Aug 2007 | Year Ago | Monthly Averages | ||
|---|---|---|---|---|---|---|---|
| 2006 | 2005 | 2004 | |||||
| Trade Balance, Mil.$ | -- | 1,597 | 1,096 | 2,361 | 1,214 | 852 | 609 |
| Exports | -- | 4,412 | 3,864 | 4,495 | 3,188 | 2,311 | 1,674 |
| Oil & Gas | -- | 2,563 | 2,401 | 3,094 | 1,968 | 1,450 | 951 |
| Other | -- | 1,849 | 1,463 | 1,401 | 1,220 | 861 | 723 |
| Imports | -- | 2,815 | 2,769 | 2,134 | 1,973 | 1,460 | 1,065 |
| Fixed Investment, Mo Avg YTD, Mil.KZT |
245.3 | 237.3 | 223.0 | 206.8 | 234.2 | 183.7 | 127.6 |
| % Change | 18.8% | 18.5% | 16.9% | 27.9% | 27.4% | 44.1% | 21.6% |
by Robert Brusca November 15, 2007
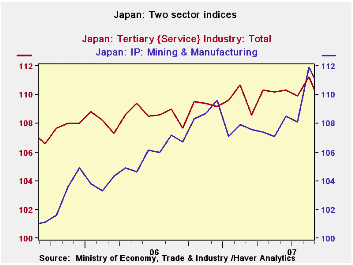
The percentile readings for Japan’s tertiary and manufacturing/mining indexes remain elevated in the top 10% of their respective ranges. In the case of the services industries their index seems to show them still on trend with a bump lower in October. In short, in September the drop does not seem to be anything to worry about, especially on the heels of a solid gain in August. The MFG series shows a slump that was probably aggravated by Japan’s earthquake. The acceleration out of that slump pushes the index up sharply and so the current setback comes at a time that the strength in the short term trend is probably overstated. Even so the pull back in September is a minor one. The moving averages show the Mining/MFG index still going higher while the service sector shows the trend for 3-Month and 6-Months has gone flat. That sector will be the one to watch.
| Japan Industry Surveys | |||||||||
|---|---|---|---|---|---|---|---|---|---|
| Recent Months | Moving Averages | Extremes; Range | |||||||
| Sep-2007 | Aug-2007 | Jul-2007 | 3-Mo | 6-Mo | 12-Mo | Max | Min | %-Tile | |
| Mining and MFG | 110.3 | 111.9 | 108.1 | 110.1 | 108.9 | 108.5 | 111.9 | 87.7 | 93.4% |
| Tertiary | 109.4 | 111.2 | 109.9 | 110.2 | 110.2 | 109.9 | 111.2 | 91.0 | 91.1% |
| Ranges, Max, Min since 1993 | |||||||||
by Robert Brusca November 15, 2007
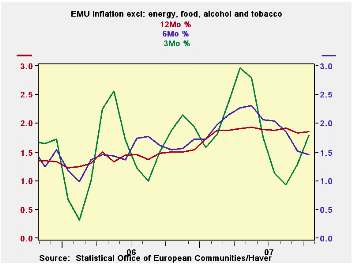
The EMU region shows accelerations in overall inflation as well as in core inflation (see table below). The goods sector (a sector that includes energy) shows inflation is steadily accelerating and services show the opposite, steady price deceleration. From the stand point of inflation this offset is good news. From the stand point of growth it may not be…
The weakness in services prices is suggestive of a domestic population besieged by rising goods prices (…some of them of inelastic demand such as food and energy) robbing spending from the services component of expenditures where relatively more of the discretionary funds may be spent. We will want to watch to see if the EMU service sectors reflect a growing weakness that would confirm that such an effect is in train.
The bottom of the table includes core inflation readings across main EMU countries and all of them show that their inflation acceleration is in train or above the ECB ceiling rate of 2%... or both.
With this report a more detailed look behind the ‘seemingly benign’ core rate of inflation of 2.1% looks a lot grimmer. With the euro rising, and the ECB warning of spreading price pressures, it puts the EMU region and the ECB in a tough spot.
| Trends in HICP | |||||||
|---|---|---|---|---|---|---|---|
| % mo/mo | % saar | ||||||
| Oct-07 | Sep-07 | Aug-07 | 3-Mo | 6-Mo | 12-Mo | Yr Ago | |
| EMU-13 | 0.4% | 0.4% | 0.0% | 3.4% | 2.7% | 2.6% | 1.6% |
| Core | 0.3% | 0.2% | 0.2% | 3.0% | 2.2% | 2.1% | 1.6% |
| Goods | 0.8% | 1.0% | 0.0% | 7.6% | 2.2% | 2.6% | 1.3% |
| Services | 0.0% | -0.5% | 0.2% | -1.5% | 1.8% | 2.5% | 2.1% |
| HICP | |||||||
| Germany | 0.2% | 0.7% | -0.1% | 3.1% | 2.7% | 2.7% | 1.1% |
| France | 0.2% | 0.1% | 0.3% | 2.6% | 2.3% | 2.1% | 1.2% |
| Italy | 0.7% | 0.3% | 0.2% | 4.7% | 3.3% | 2.3% | 1.9% |
| Spain | 0.7% | 0.4% | 0.0% | 4.3% | 3.7% | 3.7% | 2.6% |
| Core: xFE&A | |||||||
| Germany | 0.2% | 0.3% | 0.1% | 2.4% | 2.4% | 2.2% | 0.9% |
| France | 0.2% | 0.1% | 0.3% | 2.7% | 1.9% | 1.7% | 1.3% |
| Italy | 0.5% | 0.4% | 0.2% | 4.3% | 2.7% | 2.1% | 2.0% |
| Spain | 0.7% | 0.2% | 0.3% | 4.8% | 3.5% | 3.1% | 2.8% |

Tom Moeller
AuthorMore in Author Profile »Prior to joining Haver Analytics in 2000, Mr. Moeller worked as the Economist at Chancellor Capital Management from 1985 to 1999. There, he developed comprehensive economic forecasts and interpreted economic data for equity and fixed income portfolio managers. Also at Chancellor, Mr. Moeller worked as an equity analyst and was responsible for researching and rating companies in the economically sensitive automobile and housing industries for investment in Chancellor’s equity portfolio. Prior to joining Chancellor, Mr. Moeller was an Economist at Citibank from 1979 to 1984. He also analyzed pricing behavior in the metals industry for the Council on Wage and Price Stability in Washington, D.C. In 1999, Mr. Moeller received the award for most accurate forecast from the Forecasters' Club of New York. From 1990 to 1992 he was President of the New York Association for Business Economists. Mr. Moeller earned an M.B.A. in Finance from Fordham University, where he graduated in 1987. He holds a Bachelor of Arts in Economics from George Washington University.
More Economy in Brief