 Global| Apr 17 2007
U.S. CPI Gives Markets a Breath of Pretty Fresh Air
Summary
The 0.1% increase in the CPI in March (annual rate of 0.7%) is just what the CPI needed after back-to-back monthly increases of 0.3% and 0.2%, but after two such bad reports, this good one can only take the edge off bad trends; it [...]
The 0.1% increase in the CPI in March (annual rate of 0.7%) is just what the CPI needed after back-to-back monthly increases of 0.3% and 0.2%, but after two such bad reports, this good one can only take the edge off bad trends; it can’t by itself make CPI trends good. For the month, inflation was not widespread; our monthly diffusion counter was at 42.9 for the headline and 42.9 for the core. Both signal that month-to-month inflation fell in more CPI categories than it rose. But both core and headline inflation now show an accelerating three-month pace compared to six months ago.
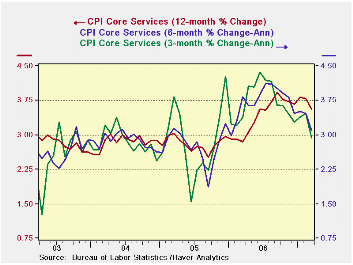
In the guts of this month’s report we find core goods prices were weak as in the PPI, falling at a 0.9% annual rate in the month. But services prices were moderate too, cutting their pace of increase to a pace of +1.4%. Still over three months core goods prices are rising by 0.4% and core services are at 2.9%. (the service sector is 71% of the core). So while the inflation game is still a tug of war between goods deflation and services inflation, both sectors say inflation pressures eased in the month. Services inflation has seen sequentially lower from 1-year to 6-months and from 6-months to 3-months.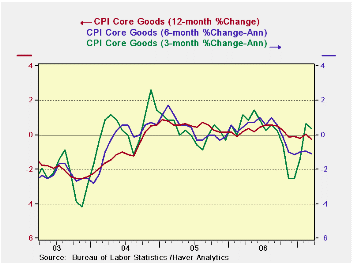
While still high, core service sector inflation trends are cooling across horizons. However, look at the graph and realize how much this has to do with just this last month’s result. Inflation had started another minor uptrend. So while the chart looks benign, the result is still quite reversible.
Core goods prices are showing persisting declines in year/year and six-month rates of change. However, at the three-month horizon goods prices have reversed to show some inflation. So the anti-inflation trend is no longer as uniformly solid as it was.
| 5COLSPAN | Year-To-Date | 1- Mo | -- | |||||
| Quick Summary | Yr/Yr | 6-Mo AR | 3-Mo AR | -- | 2007 | 2006 | Diffusion | -- |
| CPI | 2.8% | 2.4% | 4.7% | -- | 4.7% | 3.7% | 42.9 | -- |
| Core CPI | 2.5% | 1.9% | 2.3% | -- | 2.3% | 2.6% | 42.9 | -- |
| Commodity Category | ||||||||
| Mo Annualized Rate |
Annualized Inflation Rate For Last | Mo/Mo Not Annualized |
||||||
| By Expenditure Category | Mar 2007 | % Weight | 3-Mo | -- | 6-Mo | -- | Year | Mar 2007 |
| All Items | 7.5% | 100.00 | 4.7% | -- | 2.4% | -- | 2.8% | 0.6% |
| By Economic Group | ||||||||
| All: Excl Food & Energy | 0.7% | 77.10 | 2.3% | -- | 1.9% | -- | 2.5% | 0.1% |
| (Median Increase) | 3.1% | 100.00 | 4.4% | -- | 2.8% | -- | 2.7% | 0.3% |
| Excl. Energy | 1.1% | 92.32 | 2.9% | -- | 2.2% | -- | 2.6% | 0.1% |
| Commodities Excl Food & Energy | -0.9% | 22.77 | 0.4% | (29% of core) | -1.1% | -- | -0.3% | -0.1% |
| Services Excl Energy | 1.4% | 54.33 | 2.9% | (71% of core) | 3.1% | -- | 3.6% | 0.1% |
| Core CPI less Tobacco | 0.7% | -- | 2.1% | -- | 1.8% | -- | 2.4% | 0.1% |
| Food & Energy | ||||||||
| Energy | 216.3% | 7.68 | 30.9% | -- | 1.7% | -- | 6.9% | 10.1% |
| Food | 3.4% | 15.22 | 7.3% | -- | 3.9% | -- | 3.3% | 0.3% |
| · Industrial production fell by 0.2% in March as utilities output pulled back but manufacturing output advanced by a strong 0.7% led by a gain of 0.9% in durable goods output. March saw a decline in consumer goods output, materials production was flat and there was a rise of 0.8% in business equipment output. · But for the quarter as a whole and on trend, industrial production is a story of firming consumer output offset by plunging demand for equipment on the part of business with materials output vacillating about unchanged. Manufacturing output rose by 1.5% in Q1 given the strong productivity there that was not enough to create job growth in the sector. · Looking at the just completed quarter we find industrial production is higher for most measures. So the National ISM report is correct to be above 50. There is a great deal of regional disparity according to various regional manufacturing surveys. We see that in the variety of conditions across industry groups there is a great deal of variation as well. Consumer durables output in the quarter rose at a 0.1% pace as auto output fell. Consumer nondurable output rose by a robust 6% pace with energy output up at a 12% pace. Business equipment output fell in the quarter but computer and office equipment production rose by 34.3%. Materials output was mixed, up by 0.5% in the quarter but up by 1.9% for durable goods and off by 1.7% for nonenergy nondurable goods. Overall auto production fell by 0.1% in Q1 but truck production expanded at a 52% annual rate. |
|---|
| Monthly Percent Changes | At Annual Rates of Change | SAAR | |||||
| Month-to-month Percent Change | 3-Month | 6-Month | Year/Year | 07-Q1 | |||
| Industrial Output | Mar-07 | Feb-07 | Jan-07 | %Change | %Change | %Change | Pct Change |
| All Prod & Materials | -0.2% | 0.8% | -0.4% | 1.1% | 0.5% | 2.3% | 1.6% |
| All Products | -0.3% | 1.0% | -0.4% | 1.1% | 1.2% | 2.5% | 2.0% |
| Final Products | -0.3% | 1.2% | -0.5% | 1.4% | 2.3% | 3.4% | 3.1% |
| Manufacturing only | -- | -- | -- | -- | -- | -- | -- |
| MFG - NAICS | 0.7% | 0.1% | -0.6% | 0.7% | 0.5% | 2.7% | 1.5% |
| MFG - Durables | 0.8% | 0.2% | -1.1% | -0.3% | 0.7% | 3.5% | 0.4% |
| MFG - Nondurables | 0.5% | 0.0% | 0.0% | 1.9% | 0.2% | 1.9% | 3.0% |
| Consumer Goods | -0.6% | 1.7% | 0.0% | 4.1% | 2.4% | 2.1% | 4.5% |
| Durables | 0.6% | 1.7% | -2.9% | -2.6% | 0.2% | -1.2% | 0.1% |
| Automotive Production | 0.4% | 3.7% | -5.4% | -6.0% | 1.4% | -3.1% | -0.4% |
| Excl Automotive Production | 0.7% | 0.0% | -0.6% | 0.5% | -0.9% | 0.6% | 0.6% |
| Nondurables | -1.0% | 1.6% | 1.0% | 6.3% | 3.1% | 3.2% | 6.0% |
| Nonenergy | 0.6% | 0.5% | -0.1% | 4.0% | 4.8% | 3.9% | 4.3% |
| Consumption Energy | -6.1% | 5.4% | 4.5% | 13.5% | -2.2% | 0.7% | 12.1% |
| Business Equip. | 0.8% | 0.3% | -2.2% | -4.5% | 3.3% | 7.4% | -0.6% |
| Transportation | 0.2% | -0.1% | -1.4% | -5.2% | 6.0% | 7.6% | 0.3% |
| Computer & Office Equipment | 3.5% | 3.3% | 2.4% | 38.2% | 30.6% | 28.3% | 34.4% |
| Excl Technology & Transportation | 0.8% | -0.2% | -2.2% | -6.4% | 2.3% | 6.7% | -2.0% |
| Materials | 0.0% | 0.5% | -0.4% | 0.7% | -0.5% | 2.1% | 0.5% |
| Durables | 1.0% | -0.2% | 0.1% | 3.5% | -0.2% | 3.6% | 1.9% |
| Nondurables excl energy | 0.6% | 0.1% | -1.2% | -2.3% | -1.7% | 0.3% | -1.7% |
| Energy | -2.2% | 2.3% | -0.1% | -0.4% | 0.2% | 1.6% | 0.7% |
by Robert Brusca April 17, 2007
The chart on the left shows the trends for output by main manufacturing sector. As consumer output has steadied and strengthened, the business sector has been unraveling. This is an unpleasant picture and has been quite unexpected. We still do not know what is holding business back.
by Louise Curley April 17, 2007
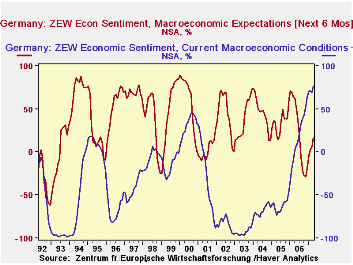
German investors surprised the economic community with a spurt of optimism. The balance of those looking for better conditions six months ahead over those looking for worsening conditions rose to 16.5% in April from 5.8% in March. In spite of the rise, however, the balance is well below that of 62.7% in April, 2006 and also well below the long term average of 33.1%.
Investors continue to be impressed with current conditions. The balance of those seeing improvement in current conditions over those seeing deterioration rose to 76.9%, an all time high, from 69.2% in March and from 2.9% in April, 2006. The first chart shows the balances for current conditions and for the outlook since December 1981, when the series began.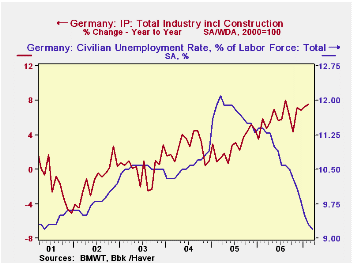
Contributing, no doubt, to the increased optimism regarding current conditions among German investors has been the continued improvement in the economy in the first months of this year. The imposition of a 3 point increase in the Value Added Tax that went into effect on January 1, 2007 has apparently had a less deleterious effect on the economy than had been feared. Retail sales declined 3.9% in January, but rose 1.26% in February. The unemployment rate of registered workers declined to 9.2% in March from 9.8% in December. Industrial production was up 7.57% in February over the corresponding month of 2006 and, on the same basis, in January, 7.24%, compared with an increase of 5.88% for all of 2006 over 2005. Unemployment rates and the year over year increases in industrial production are shown in second chart shows.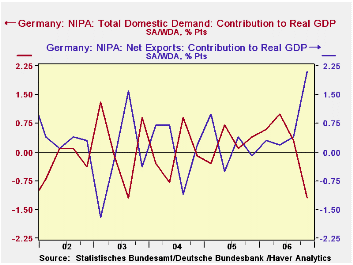
As noted above, the expectations balance is well below the long term average of 33.1%. Perhaps one of the factors that may account for the subdued expectations is the strength in the Euro and what it may mean for exports. It was export demand increasing 2.10 points that offset the 1.2 point decline in domestic demand in the final quarter of the year. The third chart shows the contributions to growth of exports and domestic demand over the last five years. Perhaps one of the questions troubling investors is whether the decline in unemployment is such that it will lead to an increase in consumer demand that could offset a decline in exports.
| GERMANY ZEW INDICATOR | Apr 07 | Mar 07 | Apr 06 | M/M Dif | Y/Y Dif | 2006 | 2005 | 2004 |
|---|---|---|---|---|---|---|---|---|
| Expectations (% Balance) | 16.5 | 5.8 | 62.7 | 10.7 | -46.2 | 22.3 | 34.8 | 44.6 |
| Current Conditions (% Balance) | 76.9 | 69.2 | 2.9 | 7.7 | 74.0 | 18.3 | -61.8 | -67.7 |
| · The table below shows the percent changes in starts and permits on different horizons without compounding. It shows that each measure except for the large projects (5 of more) is above its three-month average in March. This finding tends to reinforce the sense that there is some stability developing in the sector. To be sure, all measures are down over 3 months and 12 months. Two-to-four unit projects alone are flat or up compared to six months. Firmness on the three-month horizon is mostly in the Midwest where there is a 23% bounce (annualized) and in the South where a -12% annual rate trims the -33% annual rate drop over 6 months. |
|---|
| Seas Adj Annual Rate | Total | One Unit | 2- 4 Units | 5 or more | ||||
| In 000's of Units | Starts | Permits | Starts | Permits | Starts | Permits | Starts | Permits |
| This Month: | 1,518 | 1,544 | 1,218 | 1,114 | 38 | 72 | 262 | 358 |
| 3-month avg | 1,474 | 1,549 | 1,177 | 1,112 | 31 | 73 | 267 | 363 |
| 1-month % chg | 0.8% | 0.8% | 2.0% | 1.4% | 22.6% | 0.0% | -6.8% | -0.8% |
| 3-month % chg | -7.0% | -4.3% | -2.2% | -4.6% | -22.4% | -4.0% | -22.7% | -3.2% |
| 6-month % chg | -11.9% | -5.7% | -12.6% | -8.6% | 31.0% | 0.0% | -13.2% | 3.2% |
| yr/yr % chg | -23.0% | -25.9% | -24.6% | -28.4% | 5.6% | -13.3% | -18.4% | -19.9% |
by Robert Brusca April 17, 2007
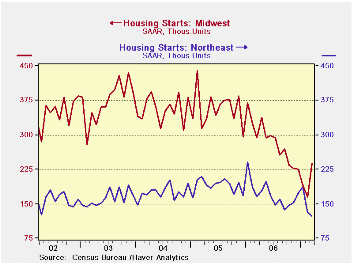
We plot the trends by region to show the common patterns. Each region shows a long down slope reflecting the lasting weakness in housing across the nation. But then most regions show some stability - or at least a hint of it.
There is an outright bounce in the Midwest and somewhat slower erosion in the West. The South is still declining but is also slowing its pace of decline. The Northeast is unclear, having bounced in January, probably on the weather, then having started a new slide since then, but still not quite making a new low. 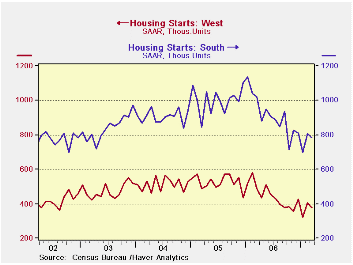
On balance, housing is still having troubles. The rise in starts this month came about only because of a DOWNWARD revision to the previous month. Had February not been revised lower the new level in March would have been a decline from February since the preliminary February reading was higher than the level of starts that now prevails in March. Even so the clearest evidence we have is that the pace of decline is slowing and that for the moment two of the three types of starts and the overall are above their 3-month average. Housing is still faltering but no longer seems to have the downward momentum. It’s sort of like a horror movie seen the second time around -- no longer any surprises and you’ve already seen the worst of it. But unlike the movie the second time around, you still don’t know where this one is going. Not for sure.

Robert Brusca
AuthorMore in Author Profile »Robert A. Brusca is Chief Economist of Fact and Opinion Economics, a consulting firm he founded in Manhattan. He has been an economist on Wall Street for over 25 years. He has visited central banking and large institutional clients in over 30 countries in his career as an economist. Mr. Brusca was a Divisional Research Chief at the Federal Reserve Bank of NY (Chief of the International Financial markets Division), a Fed Watcher at Irving Trust and Chief Economist at Nikko Securities International. He is widely quoted and appears in various media. Mr. Brusca holds an MA and Ph.D. in economics from Michigan State University and a BA in Economics from the University of Michigan. His research pursues his strong interests in non aligned policy economics as well as international economics. FAO Economics’ research targets investors to assist them in making better investment decisions in stocks, bonds and in a variety of international assets. The company does not manage money and has no conflicts in giving economic advice.
More Economy in Brief


