 Global| Sep 16 2008
U.S. CPI Fell With Gasoline Prices
by:Tom Moeller
|in:Economy in Brief
Summary
The August consumer price index (CPI-U) fell 0.1%, according to the Bureau of Labor Statistics. The Consensus expectation was for no change. Despite the decline, the three-month rate of change remained elevated at 7.2%. That will fall [...]
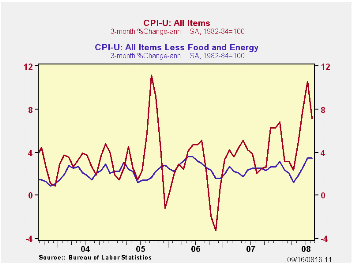
The August consumer price index (CPI-U) fell 0.1%, according to the Bureau of Labor Statistics. The Consensus expectation was for no change. Despite the decline, the three-month rate of change remained elevated at 7.2%. That will fall sharply with the September reading as a result of the further decline in energy prices.
Energy prices reversed a strong July increase and fell 3.1%. The August decline was led by a 4.2% drop in gasoline prices but they still were up by one-third from one year earlier. Fuel oil prices also posted a strong 6.5% m/m decline yet they too remained firm, up 49% versus last August. Prices for natural gas & electricity fell 1.1% (+14.7% y/y).
So far this month, not seasonally adjusted gasoline prices are down 1.6% m/m following the 7.4% decline during August.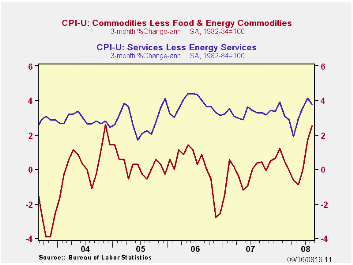
Food & beverage prices continued strong and they posted a 0.6% increase last month. The y/y gain of 5.9% remained the fastest since early 1990. Prices for meats poultry & fish repeated their July performance and rose a strong 1.0% and they are up at a 12.2% annual rate during the last three months. This compares to a 2.5% rate during the first quarter. Prices for dairy product prices also have been strong. The 0.4% August gain lifted the three-month rate of increase to 15.3% after a 7.4% rise during 2007. Prices for cereals & bakery products ticked down 0.1% (+11.7% y/y) after their 1.8% jump during July.
The 0.2% increase in the CPI less food & energy matched Consensus expectations. The 3.4% three-month rate of increase, however, remained near the quickest since mid-2006.
Core goods prices rose just 0.1% after their 0.5% jump during
July. That combination left the three-month rate of increase at 2.5%,
up from a roughly unchanged level over the last few years. Apparel
prices were strong. They posted a 0.5% increase after a 1.2% (1.7% y/y)
rise during July. Prices for household furnishings & operations
firmed, increasing 0.2% (1.2% y/y) and 0.4% in July. The y/y increase
compares to price deflation through this past April. Offsetting some of
this strength was a 0.4% (-0.9% y/y) decline in prices for new &
used motor vehicles. Tobacco prices ticked up 0.1% (7.6% y/y) following
their 1.2% spike during July.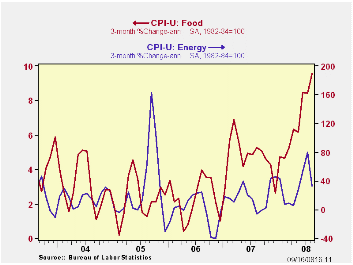
Core services prices remained firm and they rose 0.2%. That left the three-month growth rate at 3.8% which remained near the fastest in two years. Public transportation prices rose another 1.1% in July (15.2% y/y) and they're up at a 25.0% annual rate during the last three months. Medical care services prices rose 0.3% (3.9% y/y) but shelter prices nudged up only 0.1% (2.4% y/y) during August. That was the weakest y/y gain since early-2006. Owners equivalent rent of primary residence, a measure not equivalent to other house price measures, repeated the July performance and inched up 0.1% (2.5% y/y). Rents also repeated the July gain of 0.3% (3.8% y/y). Education costs have been firm. The 0.6% August rise lifted the y/y gain to 6.0%. Recreation prices also were firm and they posted a 0.5% gain. Their 2.4% y/y rise compares to a 0.5% increase during all of last year.
The chained CPI, which adjusts for shifts in consumption patterns, fell 0.2%. Less food and energy, chained prices rose 0.2%.
Housing and Financial Crisis from the Brookings Institute can be found here.
What Is the Optimal Inflation Rate? from the Federal Reserve Bank of Kansas City can be found here.
| Consumer Price Index (%) | August | July | Y/Y | 2007 | 2006 | 2005 |
|---|---|---|---|---|---|---|
| Total | -0.1 | 0.8 | 5.4 | 2.9 | 3.2 | 3.4 |
| Total less Food & Energy | 0.2 | 0.3 | 2.5 | 2.3 | 2.5 | 2.2 |
| Goods less Food & Energy | 0.1 | 0.5 | 0.6 | -0.4 | 0.2 | 0.5 |
| Services less Energy | 0.2 | 0.3 | 3.3 | 3.4 | 3.4 | 2.8 |
| Energy | -3.1 | 4.0 | 27.4 | 5.6 | 11.0 | 17.0 |
| Food & Beverages | 0.6 | 0.9 | 6.1 | 3.9 | 2.3 | 2.5 |
| Chained CPI: Total (NSA) | -0.2 | 0.4 | 4.7 | 2.5 | 2.9 | 2.9 |
| Total less Food & Energy | 0.2 | 0.2 | 2.2 | 2.0 | 2.2 | 1.9 |
by Tom Moeller September 16, 2008
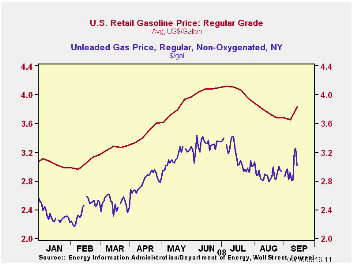
The pump price for a gallon of regular gasoline jumped nearly
twenty cents last week to $3.85 per gallon due to the threat to
refineries from Hurricane Ike, according to the U.S. Department of
Energy survey. For all grades of gasoline the average price rose last
week by eighteen cents to $3.89 per gallon.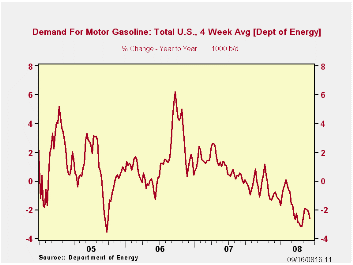
With the passage of the storm, however, the spot market price for gasoline yesterday reversed much of the increase.
Weekly gasoline prices can be found in Haver's WEEKLY database, daily prices are in the DAILY database.
According to the U.S. Department of Energy, the demand for gasoline fell 0.94% during the last four weeks. That was the largest weekly decline since this past January and it lowered gasoline demand by 2.64% year-to-year.
The DOE figures are available in Haver's OILWKLY database.
Despite the storm, the price for a barrel of West Texas Intermediate
crude oil fell last week to an average $102.85 per barrel. That's down
from the high in July of $145.66.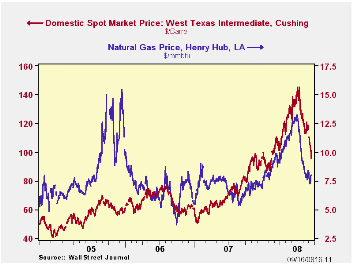
Yesterday, the crude oil price at $95.71 per barrel was down another seven dollars from last week's average.
Prices for natural gas rose slightly w/w to an average $7.70 per mmbtu (+27.5% y/y). Prices rose yesterday to $8.02/mmbtu. The high for natural gas prices was in early-July at $13.19/mmbtu.
| Weekly Prices | 09/15/08 | 09/08/08 | Y/Y | 2007 | 2006 | 2005 |
|---|---|---|---|---|---|---|
| Retail Regular Gasoline ($ per Gallon) | 3.85 | 3.65 | 38.6% | 2.80 | 2.57 | 2.27 |
| Light Sweet Crude Oil, WTI ($ per bbl.) | 102.85 | 108.42 | 30.2% | 72.25 | 66.12 | 56.60 |
by Louise Curley September 16, 2008
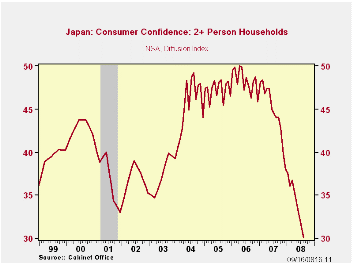
Japanese consumers couldn't be much more pessimistic than they were
in August, before the failure of Lehman Brothers. In the latest survey
of consumer confidence, the diffusion index fell to 30.1 in August from
31.4 in July. This value compares with 33.0 in the 2000-2003 recession
as shown in the first chart. (Prior to April 2004, the Consumer
Confidence indicator was recorded quarterly.) Of the components of the
index, the overall livelihood, willingness to buy durable goods and
income
growth, all are below their recession lows.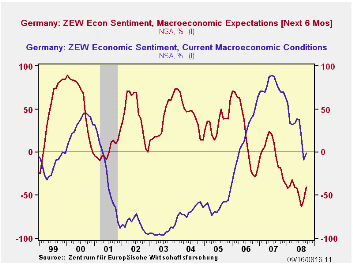
German investors and analysts, on the contrary, were slightly less
pessimistic in the ZEW September survey as shown in the second chart.
However, pessimists still out weighed optimists on their appraisal of
both current conditions and expectations. There were 1% more pessimists
than optimists appraising the current situation, compared with an
excess of 9.2% in August, and the excess of pessimists over optimists
appraising the outlook six months ahead was still 41.1%, down from
55.5% in August.
Some 31 out of 315 replies to the ZEW September survey were received
after the bankruptcy of Lehman Brothers. According to their press
release, ZEW reported that a separate analysis of these replies "shows
that the economic expectations for Germany have not deteriorated in the
course of the incident.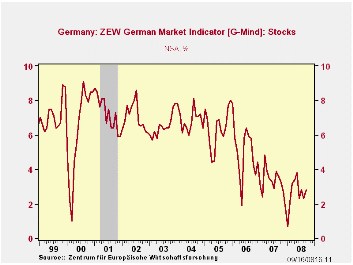
Stock market expectations, however, were corrected downwards significantly." The German market indicator, G-Mind Stocks, has been trending downward over the past three years as can be seen in the third chart. The indicator did, however, manage a slight rise in September in spite of the pessimistic views of the 31 respondents posting replies after the collapse of Lehman Brothers.
| JAPAN | Aug 08 | Jul 08 | Previous Low | M/M Dif | Chg from Low | 2007 | 2006 | 2005 |
|---|---|---|---|---|---|---|---|---|
| Consumer Confidence (Diffusion Index) | 30.1 | 31.4 | 33.0 | -1.3 | -2.9 | 44.7 | 48.3 | 47.3 |
| Overall Livelihood | 28.5 | 29.3 | 36.6 | -0.8 | -8.1 | 42.2 | 45.6 | 45.8 |
| Willingness to Buy Durable Goods | 28.3 | 29.2 | 40.9 | -0.9 | -12.6 | 45.7 | 50.0 | 49.5 |
| Income Growth | 35.0 | 36.3 | 35.3 | -1.3 | -0.3 | 42.6 | 44.7 | 44.8 |
| GERMANY | Sep 08 | Aug 08 | Sep 07 | M/M Dif | Y/Y Dif | 2007 | 2006 | 2005 |
| ZEW Indicators (% balance) | ||||||||
| Current Conditions | -1.0 | -9.2 | 74.4 | 8.2 | 75.4 | 75.9 | 18.3 | -61.8 |
| Expectations 6 mo Ahead | -41.4 | -55.8 | -18.1 | 14.4 | -23.0 | -3.0 | 22.3 | 34.8 |
| G-Mind Stocks | 2.8 | 2.3 | 3.6 | 0.5 | -0.8 | 3.3 | 5.0 | 6.4 |
by Tom Moeller September 16, 2008
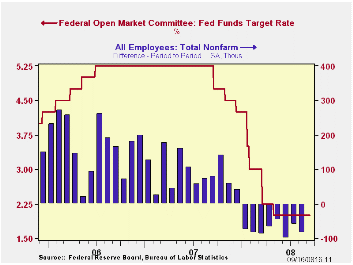
As expected, the Federal Open Market Committee left the Federal funds rate unchanged today at 2.00%. The discount rate also was left unchanged at 2.25%.
If the Fed had eased, it would have been in the name of boosting market psychology. The markets have been rattled by a significant number of downside risks to economic growth. These include strains in the financial sector as well as weaker labor markets. Weaker consumer spending, tight credit conditions, the housing contraction and slower export growth also were sited in the statement as constraints on economic growth.
While acknowledging these risks, the Fed stated that "Over time, the substantial easing of monetary policy, combined with ongoing measures to foster market liquidity, should help to promote moderate economic growth."
The Fed's statement regarding inflation was unchanged from the last
meeting. "Inflation has been high, spurred by the earlier increases in
the prices of energy and some other commodities, and some indicators of
inflation expectations have been elevated. The Committee expects
inflation to moderate later this year and next year, but the inflation
outlook remains highly uncertain."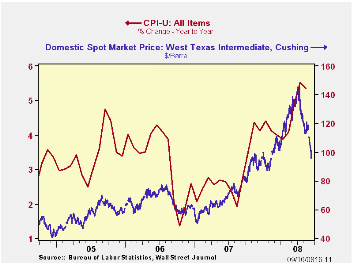
The decision was unanimous amongst FOMC voters.
For the complete text of the Fed's latest press release please follow this link.
How Economic News Moves Markets from the Federal Reserve Bank of New York can be found here.
What Drives Housing Prices? also from the Federal Reserve Bank of New York is available here.
| Current | Last | August | 2007 | 2006 | 2005 | |
|---|---|---|---|---|---|---|
| Federal Funds Rate, % (Target) | 2.00 | 2.00 | 2.00 | 5.05 | 4.96 | 3.19 |
| Discount Rate, % | 2.25 | 2.25 | 2.25 | 5.86 | 5.96 | 4.19 |
by Tom Moeller September 16, 2008
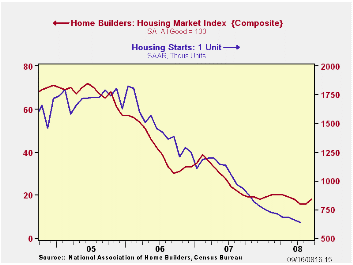
The National Association of Home Builders reported that its September Housing Market Index (HMI) improved. The rise to 18 followed two months at 16, which were the lowest readings in the twenty three history of the index. The index is compiled from survey questions asking builders to rate market conditions as “good”, “fair”, “poor” or “very high” to “very low”. Numerical equivalent results over 50 indicate a predominance of “good” readings.
Since 1990, the year-to-year change in this index has had a correlation of 72% with the year-to-year percentage change in new single-family home sales. As a result, the latest HMI index at best indicates a bottoming of the housing market's troubles.
The Home Builders Association indicated that its sub-index of
present sales conditions ticked up again, last month to 17 from 16 in
August and from the cycle low of 15 in July. 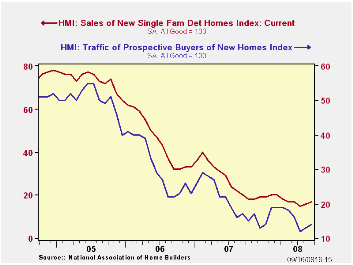
Builders’ expectations for sales six months from now improved even more to a reading of 30. That was its highest level since April. The “traffic of prospective buyers,” however, remained near its all-time low at 14.
Each of the country's regions improved last month and by the most in the Northeast and the Midwest. In the South and in the West conditions ticked up only slightly.
The NAHB has compiled the Housing Market Index since 1985. The results, along with other housing and remodeling indexes from NAHB Economics, are included in Haver’s SURVEYS database.
| Nat'l Association of Home Builders | September | August | Sept.'07 | 2007 | 2006 | 2005 |
|---|---|---|---|---|---|---|
| Composite Housing Market Index | 18 | 16 | 20 | 27 | 42 | 67 |

Tom Moeller
AuthorMore in Author Profile »Prior to joining Haver Analytics in 2000, Mr. Moeller worked as the Economist at Chancellor Capital Management from 1985 to 1999. There, he developed comprehensive economic forecasts and interpreted economic data for equity and fixed income portfolio managers. Also at Chancellor, Mr. Moeller worked as an equity analyst and was responsible for researching and rating companies in the economically sensitive automobile and housing industries for investment in Chancellor’s equity portfolio. Prior to joining Chancellor, Mr. Moeller was an Economist at Citibank from 1979 to 1984. He also analyzed pricing behavior in the metals industry for the Council on Wage and Price Stability in Washington, D.C. In 1999, Mr. Moeller received the award for most accurate forecast from the Forecasters' Club of New York. From 1990 to 1992 he was President of the New York Association for Business Economists. Mr. Moeller earned an M.B.A. in Finance from Fordham University, where he graduated in 1987. He holds a Bachelor of Arts in Economics from George Washington University.
More Economy in Brief


