 Global| Oct 16 2008
U.S. CPI Fell Again With Lower Gasoline Prices
by:Tom Moeller
|in:Economy in Brief
Summary
The consumer price index (CPI-U) fell just slightly last month, according to the Bureau of Labor Statistics, after an unrevised 0.1% dip during August. Consensus expectations had been for a 0.1% uptick. The latest figure lowered the [...]
The consumer price index (CPI-U) fell just slightly last month, according to the Bureau of Labor Statistics, after an unrevised 0.1% dip during August. Consensus expectations had been for a 0.1% uptick. The latest figure lowered the three-month rate of change to 2.6% from 7.2%.
Energy prices again moved lower, during
September by 1.9%. Fuel oil prices fell hard by 5.8% (+38.2% y/y) after
a 6.5% skid in August. Prices for natural gas & electricity
also were quite weak and they fell 3.2% (+10.9% y/y). Gasoline prices
dipped just 0.6% (+31.7% y/y) but they have since moved lower this
month to $3.15 from an average $3.70 last month. 
Food & beverage prices rose the same, strong 0.6% as they did during August. The y/y gain of 6.0% was the fastest since early 1990. For the third straight month prices for meats poultry & fish rose 1.0% and they are up at a 12.9% annual rate during that period. Prices for cereals & bakery products jumped 1.1% (12.3% y/y) but prices for dairy product prices fell 0.6% (+4.9% y/y).
The CPI less food & energy rose just 0.1% and the gain fell slightly short of expectations for a 0.2% increase. The three-month rate of increase fell back to 2.7% from its recent high of 3.5%.
Core goods prices reversed the August
increase and fell 0.2%. The decline was led by lower prices for new
& used motor vehicles which were down another 0.9% (-1.6% y/y).
Apparel prices fell 0.1% but the y/y increase remained positive at
1.4%. Apparel prices fell 0.4% last year. Prices for household
furnishings & operations rose 0.5% (1.2% y/y) and that was
enough to pull the y/y gain to 1.9%, the strongest y/y increase since
2000. Tobacco prices were unchanged (6.8% y/y).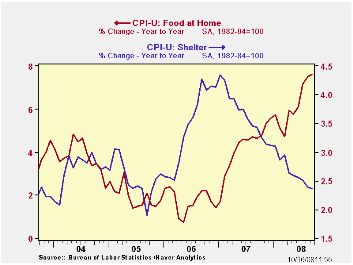
Core services prices were firm again and they rose 0.3%. That left the three-month growth rate at 3.2%. Medical care services prices continued firm and they rose 0.4% (3.8% y/y). Education costs also have been strong and last month rose 0.4% (6.1% y/y). Shelter prices increased 0.3% (2.4% y/y) but that was the weakest y/y gain since early-2006. Owners equivalent rent of primary residence, a measure not equivalent to other house price measures, increased 0.2% (2.4% y/y). Rents rose for the third straight month by 0.3% (3.8% y/y). Public transportation prices gave back a piece of prior months' strength with a 1.0% decline (13.3% y/y). Though recreation prices rose just 0.2%, the 2.4% y/y rise compares to a 0.5% increase during all of last year.
The chained CPI, which adjusts for shifts in consumption patterns, fell 0.1%. Less food and energy, chained prices rose 0.2% for the third straight month.
Yesterday's speech by Fed Chairman Ben S. Bernanke can be found here.
Fed Vice Chairman Donald L. Kohn also spoke yesterday on the Economic Outlook and his comments can be found here.
| Consumer Price Index (%) | September | August | Y/Y | 2007 | 2006 | 2005 |
|---|---|---|---|---|---|---|
| Total | -0.0 | -0.1 | 4.9 | 2.9 | 3.2 | 3.4 |
| Total less Food & Energy | 0.1 | 0.2 | 2.5 | 2.3 | 2.5 | 2.2 |
| Goods less Food & Energy | -0.2 | 0.1 | 0.5 | -0.4 | 0.2 | 0.5 |
| Services less Energy | 0.3 | 0.2 | 3.2 | 3.4 | 3.4 | 2.8 |
| Energy | -1.9 | -3.1 | 23.3 | 5.6 | 11.0 | 17.0 |
| Food & Beverages | 0.6 | 0.6 | 6.0 | 3.9 | 2.3 | 2.5 |
| Chained CPI: Total (NSA) | -0.1 | -0.2 | 4.3 | 2.5 | 2.9 | 2.9 |
| Total less Food & Energy | 0.2 | 0.2 | 2.2 | 2.0 | 2.2 | 1.9 |
by Robert Brusca October 16, 2008
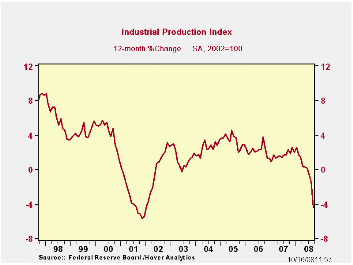
US industrial output, an index of real output, is off by 2.8%
in September but the drop is exaggerated by the impact of two
hurricanes and a job action at aircraft manufacturer Boeing. The
Federal Reserve Board reported that the disruptions from the hurricanes
contributed about 2.25 percentage points to the decline while the
Boeing strike contributed 0.5 percentage point.
The drop is beginning to look like the drops IP made in the
last recession. Declines in output are widespread in September.
For the quarter which is now complete based on preliminary
data the drop in output is at a rate of -6%, a substantial pace of
decline for a quarter (saar). Consumer goods output is down at a -6%
pace with consumer goods ex-auto output down at a pace of -8.2% and
consumer energy off at a -12.6% pace. In this framework auto output
rose in September but fell in the quarter at a pace of -5%. The
consumer vehicle sector is not what is leading us lower.
The business sector is leading us lower. The business sector
saw a sharper decline with business equipment output off by -8.4% saar
led by a whopping decline of -41% (saar) for transportation. Materials
output was off at a pace of -6%.
The weakness in the industrial sector clearly is widespread.
The slowing in US exports will hit the sector hard. Manufacturing has
been shedding jobs but at a slower pace than it has in most recessions.
It looks like the pace of job losses in MFG is about to pick up. That
in turn that will send waves of repercussions throughout the economy as
a vicious circle of job cuts is likely to ensue since workers that lose
jobs also are consumers that lose income. As that happens spending
drops and that leads to more job cuts. It is vicious circle time: Not
Miller time.
| Industrial Production | |||||||
|---|---|---|---|---|---|---|---|
| Monthly Pct. Changes | At Annual Rates of Change | SAAR | |||||
| Month-to-month Pct. Change | 3-Month | 6-Month | Year/Year | 08-Q3 | |||
| Industrial Output | Sep-08 | Aug-08 | Jul-08 | %Change | %Change | %Change | Pct Change |
| All Prod&Materials | -2.8% | -0.9% | -0.1% | -15.1% | -8.4% | -4.5% | -6.0% |
| All Products | -2.3% | -1.1% | -0.2% | -14.1% | -7.9% | -4.9% | -5.9% |
| Final Products | -2.5% | -1.2% | -0.2% | -15.6% | -8.5% | -4.9% | -5.8% |
| Manufacturing only | |||||||
| MFG - NAICS | -2.7% | -1.0% | 0.0% | -14.4% | -8.6% | -4.8% | -5.8% |
| MFG-Durables | -2.4% | -1.5% | 0.3% | -14.2% | -9.2% | -4.6% | -4.8% |
| MFG-Nondurables | -2.9% | -0.4% | -0.4% | -14.4% | -7.9% | -4.9% | -7.0% |
| Consumer Goods | -1.3% | -1.7% | -0.3% | -13.1% | -6.9% | -5.0% | -6.0% |
| Durables | -0.7% | -6.2% | 1.1% | -23.1% | -13.1% | -11.7% | -6.7% |
| Automotive Prod. | 1.7% | -10.9% | 1.9% | -30.6% | -17.3% | -15.2% | -5.0% |
| Ex. Automotive Prod. | -2.7% | -1.7% | 0.4% | -15.9% | -9.0% | -8.1% | -8.2% |
| Nondurables | -1.6% | -0.6% | -0.5% | -10.6% | -5.5% | -3.1% | -5.7% |
| NonEnergy | -0.4% | 0.0% | -0.5% | -3.7% | -2.4% | -1.7% | -2.5% |
| Cons Energy | -4.4% | -1.6% | -0.5% | -25.8% | -12.2% | -5.9% | -12.6% |
| Business Equip. | -7.0% | -0.2% | 0.0% | -28.7% | -16.5% | -7.0% | -8.4% |
| Transportation | -33.6% | -4.5% | 0.2% | -145.6% | -72.9% | -38.2% | -41.0% |
| Computer & Office Eqpt | 0.9% | 0.6% | 0.1% | 6.4% | 6.7% | 15.6% | 4.2% |
| Ex. Tech.& T-port | -9.2% | 0.4% | -0.3% | -36.6% | -21.7% | -10.4% | -11.5% |
| Materials | -3.4% | -0.8% | 0.2% | -16.0% | -9.0% | -3.8% | -6.0% |
| Durables | -1.0% | -1.0% | 0.2% | -7.6% | -5.2% | -1.8% | -3.3% |
| Nondurables excl Energy | -3.3% | -0.3% | -0.6% | -16.6% | -9.4% | -6.6% | -7.8% |
| Energy | -6.2% | -0.9% | 0.8% | -25.0% | -13.2% | -4.1% | -7.8% |
by Carol Stone October 16, 2008
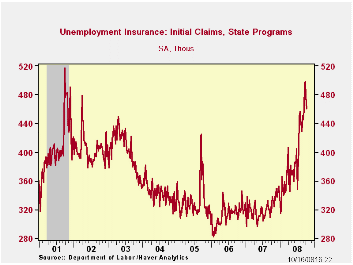
Initial claims for unemployment insurance fell 16,000 in the
week ended last Saturday to 461,000 from the prior week's 477,000.The
four-week moving average barely changed from 482,500 to 483,250 (+50.2%
y/y). The Labor Department estimates that 12,000 claims in the latest
week were due to Hurricane Ike in Texas, less than the hurricane
effects the two weeks before of 17,000 (10/4) and 45,000 (9/27).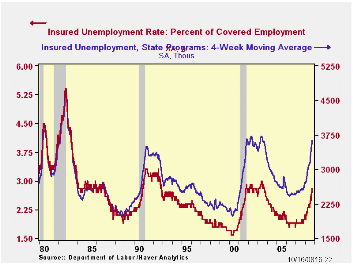
Continuing claims for unemployment insurance during the October 4 week rose 40,000 following an upwardly revised 68,000 increase during the prior period. The four-week average of claims rose to 3,632,000, the highest level since July 2003. Continuing claims provide some indication of workers' ability to find employment and they lag the initial claims figures by one week.
Claims under the new "EUC" program, Emergency Unemployment Compensation, enacted during the summer, reached 1,345,375 in the September 27 week, up 278,298 from September 20. These people have exhausted all regular benefits and are granted an additional 13 weeks while they continue to job-hunt.
The insured rate of unemployment edged up to 2.8% in the October 4 week, a cycle high and the highest since exactly the same week in 2003. The high in that recessionary period was 3.0%, reached in late June 2003.
| Unemployment Insurance (000s) | 10/11/08 | 10/04/08 | 09/27/08 | Y/Y | 2007 | 2006 | 2005 |
|---|---|---|---|---|---|---|---|
| Initial Claims | 461 | 477 | 499 | 36.4% | 322 | 313 | 331 |
| Continuing Claims | -- | 3,711 | 3,671 | 45.6 | 2,552 | 2,459 | 2,662 |
by Robert Brusca October 16, 2008
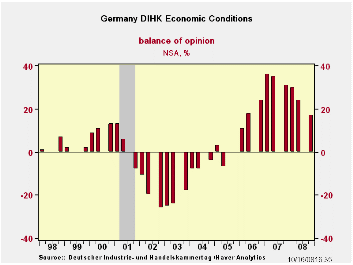
The German Chamber of Industry and Commerce survey (DIHK) shows a steady if not rapid deterioration in the current assessment and in the expectations for the period ahead. Economic conditions slipped from a reading of +24 in Q2 to +17 in Q4 dropping their standing to the 69th percentile from the 80th percentile previously. Business expectations dropped from +6 to -9 as the percentile standing fell to the 41st percentile from the 76th percentile, a sharp drop off and a move away from a nice position above the range midpoint to substantially below it.
Investment intentions have also crossed into negative territory, dropping from +6 to -2. But in terms of the percentile standing, the drop off is not as severe as the percentile fall from the 78th to the 60th percentile still leaves a firm reading in place not one that is below average. A modest negative number is still above the mid-point response for German firms’ capital spending intentions. Hiring intentions also fell to a negative reading from +6 in Q2 2008 to -3 in Q4 2008. Similarly the percentile ranking fell from the 86th to the 66th percentile for hiring plans.
The survey was conducted in late September and early October so some of the worst of the recent financial markets events were probably not taken into consideration in the survey. However in mid and late September the stock market was extremely choppy and volatile. It is unclear how much of this affected respondent expectations and assessments.
In the survey German firms also expressed more concerns about foreign growth and with that diminished expectations for German exports.
| DIHK-Balance of Economic Opinion | ||||||||
|---|---|---|---|---|---|---|---|---|
| Net Balance Readings | Change | Range Q4'91 | Percentile | |||||
| Q4-08 | Q2-08 | Q1-08 | Yr Ago | 2-Yr | 3-Yr | Q4-08 | Q2-08 | |
| Economic Conditions | 17 | 24 | 30 | -14 | -7 | 17 | 69.4 | 80.6 |
| Business Expectations | -9 | 6 | 10 | -24 | -18 | -12 | 41.1 | 67.9 |
| Export Expectations | 14 | 26 | 36 | -25 | -21 | -18 | 54.8 | 74.2 |
| Investment Intentions | -2 | 6 | 9 | -15 | -9 | 4 | 60.9 | 78.3 |
| Hiring Intentions | -3 | 6 | 7 | -12 | -3 | 11 | 66.7 | 86.7 |

Tom Moeller
AuthorMore in Author Profile »Prior to joining Haver Analytics in 2000, Mr. Moeller worked as the Economist at Chancellor Capital Management from 1985 to 1999. There, he developed comprehensive economic forecasts and interpreted economic data for equity and fixed income portfolio managers. Also at Chancellor, Mr. Moeller worked as an equity analyst and was responsible for researching and rating companies in the economically sensitive automobile and housing industries for investment in Chancellor’s equity portfolio. Prior to joining Chancellor, Mr. Moeller was an Economist at Citibank from 1979 to 1984. He also analyzed pricing behavior in the metals industry for the Council on Wage and Price Stability in Washington, D.C. In 1999, Mr. Moeller received the award for most accurate forecast from the Forecasters' Club of New York. From 1990 to 1992 he was President of the New York Association for Business Economists. Mr. Moeller earned an M.B.A. in Finance from Fordham University, where he graduated in 1987. He holds a Bachelor of Arts in Economics from George Washington University.
More Economy in Brief


