 Global| Jan 16 2009
U.S. CPI Fell A Third Month Due To Lower Energy Prices
by:Tom Moeller
|in:Economy in Brief
Summary
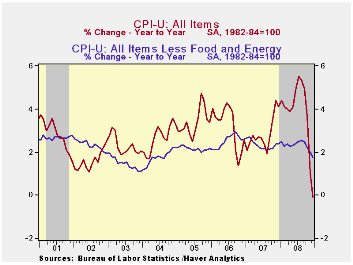
According to the Bureau of Labor Statistics, the consumer price index (CPI-U) fell for the third straight month in December. The 0.7% decline followed drops of 1.7% and 1.0% during November and October. Indeed. that, understates the [...]
 According
to the Bureau of Labor Statistics, the consumer price index
(CPI-U) fell for the third straight month in December. The 0.7% decline
followed drops of 1.7% and 1.0% during November and October. Indeed.
that, understates the weakness in pricing since there was a
less-than-0.1% decline in September. The latest reading lowered the
three-month rate of change to -12.7% (AR). That pulled
seasonally adjusted prices lower by 0.1% for the last twelve months,
the first such decline since 1955. The recent figure
compared to Consensus expectations for a 0.9% decline.
According
to the Bureau of Labor Statistics, the consumer price index
(CPI-U) fell for the third straight month in December. The 0.7% decline
followed drops of 1.7% and 1.0% during November and October. Indeed.
that, understates the weakness in pricing since there was a
less-than-0.1% decline in September. The latest reading lowered the
three-month rate of change to -12.7% (AR). That pulled
seasonally adjusted prices lower by 0.1% for the last twelve months,
the first such decline since 1955. The recent figure
compared to Consensus expectations for a 0.9% decline.
Lower energy prices led the weakness in last month's CPI with an 8.3% decline, the fifth consecutive monthly drop. It was paced by a 17.2% decline in gasoline prices to an average of $1.69 per gallon. Gas prices have backed up a bit this in January to an average $1.78 last week. December fuel oil prices fell 9.2% (-14.4% y/y) for their fifth consecutive monthly drop and prices for natural gas & electricity were roughly unchanged m/m (+7.9% y/y).
Increases in food & beverage prices tapered off and posted a slight December decline. That followed moderate increases of 0.3% and 0.2% during the prior two months. However, monthly increases between 0.6% and 0.9% were common earlier in the year. Therefore, the year-to-year growth in food prices during 2008 was the strongest since 1981.
 Core pricing power
also weakened further in December with the developing recession. The CPI
less food & energy slipped and it was down at a 0.3%
annual rate during the last three months. It reached a peak three-month
rate of increase of 3.5% just this past July and the latest change was
the weakest since 1982.
Core pricing power
also weakened further in December with the developing recession. The CPI
less food & energy slipped and it was down at a 0.3%
annual rate during the last three months. It reached a peak three-month
rate of increase of 3.5% just this past July and the latest change was
the weakest since 1982.
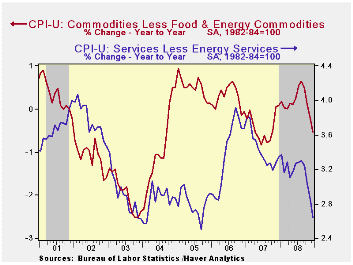
Core goods prices fell for the fourth consecutive month. The 0.3% decline pulled the three-month rate of change to a negative 3.4% which was the weakest since late-2003. The latest decline was led by another fall in prices of new & used motor vehicles which were off 0.4% (-3.5% y/y). Apparel prices also fell last month by 0.9% and they dropped 1.0% last year. Prices for household furnishings & operations ticked up 0.1% after their 0.2% November drop. However, the 2.0% year-to-year gain was the firmest since 2005. Tobacco prices rose 0.5% last month and they were up 6.3% during the full year.
Core services prices again
ticked up by 0.1% and they rose at a 1.0% annual rate during the last
three months. That was the lowest rate of increase since
1982. Medical care services prices rose a moderate 0.2% (3.0%
y/y) but education costs remained strong. They posted a 0.5%
increase (5.6% y/y) during December. 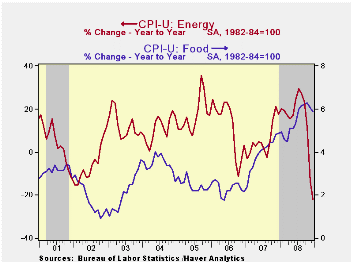 Shelter prices were unchanged m/m
and the year-to-year gain of 1.9% was the weakest since 2005. As the
housing market remained deeply depressed owners equivalent rent of
primary residence, a measure not equivalent to other house price
measures, rose just 0.1% (2.1% y/y). Public transportation
prices fell for the fourth consecutive month and were up just 1.8%
year-to-year. Recreation prices fell 0.2% and they rose a modest 1.8%
y/y.
Shelter prices were unchanged m/m
and the year-to-year gain of 1.9% was the weakest since 2005. As the
housing market remained deeply depressed owners equivalent rent of
primary residence, a measure not equivalent to other house price
measures, rose just 0.1% (2.1% y/y). Public transportation
prices fell for the fourth consecutive month and were up just 1.8%
year-to-year. Recreation prices fell 0.2% and they rose a modest 1.8%
y/y.
The chained CPI, which adjusts for shifts in consumption patterns, fell 1.3%. Less food and energy, chained prices fell 0.3% for the second month and the year-to-year gain of 1.3% was the lowest since early 2004.
Rethinking the Measurement of Household Inflation Expectations: Preliminary Findings from the Federal Reserve Bank of New York is available here.
| Consumer Price Index (%) | December | November | Y/Y | 2008 | 2007 | 2006 |
|---|---|---|---|---|---|---|
| Total | -0.7 | -1.7 | -0.1 | 3.8 | 2.9 | 3.2 |
| Total less Food & Energy | -0.0 | 0.0 | 1.7 | 2.3 | 2.3 | 2.5 |
| Goods less Food & Energy | -0.3 | -0.2 | -0.5 | 0.1 | -0.4 | 0.2 |
| Services less Energy | 0.1 | 0.1 | 2.6 | 3.1 | 3.4 | 3.4 |
| Energy | -8.3 | -17.0 | -21.9 | 13.6 | 5.6 | 11.0 |
| Food & Beverages | -0.0 | 0.2 | 5.8 | 5.4 | 3.9 | 2.3 |
| Chained CPI: Total (NSA) | -1.3 | -2.0 | -0.5 | 3.3 | 2.5 | 2.9 |
| Total less Food & Energy | -0.3 | -0.3 | 1.3 | 2.0 | 2.0 | 2.2 |

Tom Moeller
AuthorMore in Author Profile »Prior to joining Haver Analytics in 2000, Mr. Moeller worked as the Economist at Chancellor Capital Management from 1985 to 1999. There, he developed comprehensive economic forecasts and interpreted economic data for equity and fixed income portfolio managers. Also at Chancellor, Mr. Moeller worked as an equity analyst and was responsible for researching and rating companies in the economically sensitive automobile and housing industries for investment in Chancellor’s equity portfolio. Prior to joining Chancellor, Mr. Moeller was an Economist at Citibank from 1979 to 1984. He also analyzed pricing behavior in the metals industry for the Council on Wage and Price Stability in Washington, D.C. In 1999, Mr. Moeller received the award for most accurate forecast from the Forecasters' Club of New York. From 1990 to 1992 he was President of the New York Association for Business Economists. Mr. Moeller earned an M.B.A. in Finance from Fordham University, where he graduated in 1987. He holds a Bachelor of Arts in Economics from George Washington University.
More Economy in Brief


