 Global| May 19 2010
U.S. CPI: Broad-Based Weakness IsBehind Slight M/M Decline
by:Tom Moeller
|in:Economy in Brief
Summary
Moderate economic improvement since the middle of last year has done nothing to improve retail pricing power. The Consumer Price Index for April fell 0.1% (+2.2% y/y) and reversed a modest 0.1% uptick in March. The latest figure fell [...]
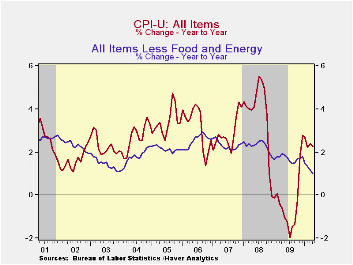
Moderate economic improvement since the middle of last year has done nothing to improve retail pricing power. The Consumer Price Index for April fell 0.1% (+2.2% y/y) and reversed a modest 0.1% uptick in March. The latest figure fell short of Consensus expectations for a 0.1% gain. Moreover, continuing weak was the 0.5% (AR) CPI increase so far this year.
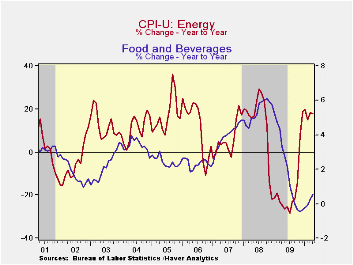
A 1.4% drop in energy prices was behind much of last month's total decline, the third consecutive monthly slip. A 4.4% drop (-2.9% y/y) in natural gas prices led the decline followed by a 2.4% drop in gasoline prices (+38.3% y/y). Higher fuel oil prices (28.0% y/y) offset much of these declines along with an uptick in electricity costs (0.6% y/y).
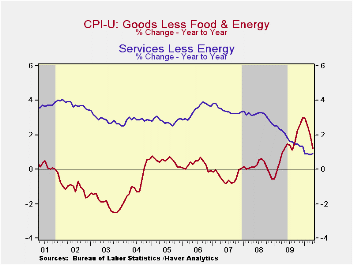
Core consumer prices also were weak. They were unchanged for the second consecutive month. A 0.1% increase had been expected and prices have gained just 0.1% since October. Core goods prices led the weakness with a 0.3% decline, the third consecutive monthly shortfall. Lower apparel prices fell by a sharp 0.7% (-0.9% y/y) while prices of home furnishings & operation declined by 0.5% (-2.8% y/y). New & used motor vehicles prices rounded off the weakness and slipped 0.2% (+4.9% y/y). Tobacco prices nudged up 0.1% (6.1% y/y).
Core services prices strengthened marginally and rose 0.2% (0.9% y/y). That improvement was led by a quickened 1.7% increase (8.4% y/y) in the cost of public transportation. The 0.3% increase in recreation prices also was a bit improved (-0.4% y/y). Elsewhere, weakness in the housing market left shelter prices unchanged and down 0.6% y/y. Owners equivalent rent of primary residences, a measure not equivalent to other house price measures, slipped again m/m (-0.2% y/y). The slight y/y decline in this measure was the weakest reading since the series' start in 1983. Elsewhere in services, education costs rose 0.5% (5.0% y/y) and medical care services prices again rose 0.3% (3.7% y/y).
Food & beverage prices again firmed a bit by 0.2% and the y/y gain of 0.5% was improved from late-last year's low of -0.5%. Dairy prices firmed by 0.1% y/y versus the 10.4% decline last summer. Also showing less deflation were prices for meats, poultry, fish & eggs (-0.2% y/y) but cereal & bakery product prices continued weak (-0.9% y/y). Fruit & vegetable prices slipped m/m but the 1.8% y/y increase is improved from a 6.5% decline as of last summer. Finally, the cost of eating out rose just 1.1% y/y, a record low increase, while alcoholic beverage prices also rose just 1.2% y/y, the least since 1995.
The chained CPI, which adjusts for shifts in consumption patterns, eased last month and rose 2.3% year-to-year. Chained prices less food & energy gained just 0.6% y/y.
The consumer price data is available in Haver's USECON database while detailed figures can be found in the CPIDATA database.
| Consumer Price Index (%) | April | March | February | April y/y | 2009 | 2008 | 2007 |
|---|---|---|---|---|---|---|---|
| Total | -0.1 | 0.1 | 0.0 | 2.2 | -0.3 | 3.8 | 2.9 |
| Total less Food & Energy | 0.0 | 0.0 | 0.1 | 1.0 | 1.7 | 2.3 | 2.3 |
| Goods less Food & Energy | -0.3 | -0.1 | -0.1 | 1.2 | 1.3 | 0.1 | -0.4 |
| Services less Energy | 0.2 | 0.1 | 0.1 | 0.9 | 1.9 | 3.1 | 3.4 |
| Energy | -1.4 | -0.0 | -0.5 | 18.0 | -18.1 | 13.7 | 5.6 |
| Food & Beverages | 0.2 | 0.2 | 0.0 | 0.5 | 1.9 | 5.4 | 3.9 |
| Chained CPI: Total (NSA) | 0.2 | 0.4 | -0.0 | 2.3 | -0.1 | 3.7 | 2.5 |
| Total less Food & Energy | 0.0 | 0.2 | 0.2 | 0.6 | 1.5 | 2.0 | 1.9 |
by Robert Brusca May 19, 2010
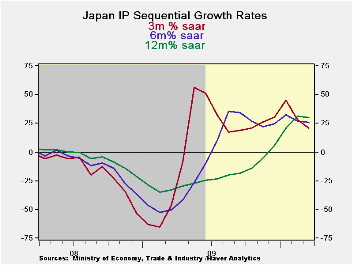
Industrial output in Japan soared in March but could not stave off an erosion in the Yr/Yr rate of growth. Output was up by 1.2% m/m across the major sectors. But that followed a result in February that was less than stellar, headlined by a 0.6% drop in IP.
The sequential growth rates in the table show growth at a Yr/Yr pace of 29.9%, a six month annualized pace of 25.6% and a three-month annualized pace of 20.9%. While the growth rates progressively step lower they are still way too elevated to be sustainable. While there is still a lot of slack in Japan’s economy some deceleration in the growth rates is just what the economy needs to keep its expansion on the ‘long track’ which is better than the ‘fast track.’
Yesterday Japan reported its service sector index took a large step back from the previous month’s value. That sort of step back is more worrisome. Japan, the US, and Europe need to drive their respective service sectors to better results. That sector is where the jobs are and that sector has been growing painfully slowly across countries.
Manufacturing continues to do well in the global economy. Japan is farther from making a full recovery that Europe or the US but it is pushing hard on the recovery path. This month’s IP report is a good one.
| Japan Industrial Production Trends | |||||||||
|---|---|---|---|---|---|---|---|---|---|
| m/m % | Saar % | Yr/Yr | Qtr-2 Date %AR |
% 0f Cycle Peak |
|||||
| seas adjusted | Mar 10 |
Feb 10 |
Jan 10 |
3-mo | 6-mo | 12-mo | Yr-Ago | ||
| Mining & MFG | 1.2% | -0.6% | 4.3% | 20.9% | 25.6% | 29.9% | -32.8% | 30.9% | 86.1% |
| Total Industry | 1.2% | -1.1% | 4.6% | 20.3% | 24.9% | 28.9% | -32.0% | 30.5% | 86.5% |
| MFG | 1.2% | -0.6% | 4.3% | 20.9% | 25.6% | 30.0% | -33.0% | 30.9% | 86.1% |
| Textiles | 1.2% | -2.6% | 3.8% | 9.4% | 4.9% | 2.1% | -23.1% | 8.1% | 72.9% |
| T-port | 1.2% | 0.8% | 12.2% | 71.5% | 59.5% | 87.0% | -53.9% | 88.5% | 83.1% |
| Product Group | |||||||||
| Consumer Gds | 3.0% | -3.4% | 0.9% | 1.6% | 8.9% | 20.1% | -24.6% | 4.9% | 87.6% |
| Intermediate Gds | -0.6% | -0.2% | 6.5% | 24.8% | 32.0% | 43.6% | -37.6% | 45.9% | 89.0% |
| Investment Gds | 2.0% | 4.1% | 4.4% | 51.2% | 34.6% | 15.9% | -31.4% | 47.6% | 76.3% |
| Miining | 0.1% | 3.3% | 1.1% | 19.2% | -8.6% | 1.4% | -9.1% | 14.1% | 87.9% |
| Electric&Gas | -0.9% | 2.0% | 2.2% | 14.3% | 20.2% | 7.8% | -7.5% | 19.3% | 94.5% |
by Tom Moeller May 19,2010
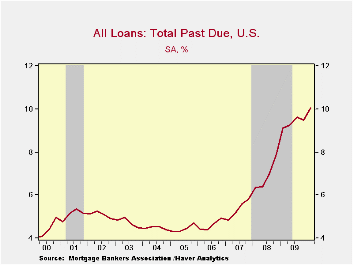
Financial strains in the housing market just won't let up. The Mortgage Bankers Association reported that as of last quarter, a record 10.1% of all mortgages were late. That's up from 9.5% at the end of last year and nearly double the rate before the last recession began. Including those loans in inventory the percentage is an even higher 14.0%.
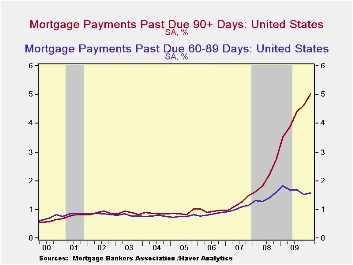
The record number of delinquencies is quite notable for those late by 90 days and over. The rise to 5.0% is up from 1.5% in 2007. For those late by 90 days or less, the figure actually is down from the peak in early 2009, though it's up since before the recession.
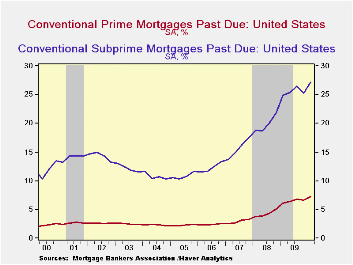
No category of mortgages has seen delinquencies rise more than amongst subprime borrowers. Here, more than one-quarter of the loans were past due last quarter versus 7.3% for prime loans. The largest increase has occurred for those late by more than 90 days to 15.0% of loans from 3% in 2004.
Despite the rise in delinquencies, lenders have found it more promising to renegotiate loan terms than to foreclose. As a result, the foreclosure rate has fallen to 1.2% from its high during the middle of last year of 1.5%.
The Mortgage Bankers data is available in Haver's MBAMTG database.
The minutes to the latest FOMC meeting can
be found here.
| Mortgage Loan Delinquency Rate (%) | 1Q '10 | 4Q '09 | 3Q '09 | 2009 | 2008 | 2007 |
|---|---|---|---|---|---|---|
| All Mortgages Past Due | 10.1 | 9.5 | 9.6 | 9.5 | 7.9 | 5.8 |
| 30-59 Days | 3.5 | 3.3 | 3.6 | 3.3 | 3.5 | 3.2 |
| 60-89 Days | 1.6 | 1.5 | 1.7 | 1.5 | 1.6 | 1.2 |
| 90 Days & Over | 5.0 | 4.6 | 4.4 | 4.6 | 2.8 | 1.5 |
| Conventional Prime | 7.3 | 6.7 | 6.8 | 6.7 | 5.1 | 3.2 |
| Conventional Subprime | 27.2 | 25.3 | 26.4 | 25.3 | 21.9 | 17.3 |
| Mortgages in Foreclosure | 1.2 | 1.1 | 1.4 | 5.4 | 4.3 | 2.8 |

Tom Moeller
AuthorMore in Author Profile »Prior to joining Haver Analytics in 2000, Mr. Moeller worked as the Economist at Chancellor Capital Management from 1985 to 1999. There, he developed comprehensive economic forecasts and interpreted economic data for equity and fixed income portfolio managers. Also at Chancellor, Mr. Moeller worked as an equity analyst and was responsible for researching and rating companies in the economically sensitive automobile and housing industries for investment in Chancellor’s equity portfolio. Prior to joining Chancellor, Mr. Moeller was an Economist at Citibank from 1979 to 1984. He also analyzed pricing behavior in the metals industry for the Council on Wage and Price Stability in Washington, D.C. In 1999, Mr. Moeller received the award for most accurate forecast from the Forecasters' Club of New York. From 1990 to 1992 he was President of the New York Association for Business Economists. Mr. Moeller earned an M.B.A. in Finance from Fordham University, where he graduated in 1987. He holds a Bachelor of Arts in Economics from George Washington University.
More Economy in Brief


