 Global| Oct 15 2004
U.S. Consumer Spending Firm
by:Tom Moeller
|in:Economy in Brief
Summary
US retail sales jumped 1.5% last month following a little revised 0.2% decline in August. The gain far outpaced Consensus expectations for a 0.6% rise. Higher sales of motor vehicles led the surge. A 4.2% jump in sales at motor [...]
US retail sales jumped 1.5% last month following a little revised 0.2% decline in August. The gain far outpaced Consensus expectations for a 0.6% rise.
Higher sales of motor vehicles led the surge. A 4.2% jump in sales at motor vehicle & parts dealers reflected the 5.5% m/m increase in unit sales of light vehicles
Excluding motor vehicles sales rose 0.6% after an unrevised 0.2% gain in August. Consensus expectations had been for a 0.4% increase.
Discretionary spending rebounded from a lackluster performance in August. Clothing & accessory store sales rose 0.8% (4.0% y/y) following a 0.7% August drop that was half the decline initially reported.Sales at general merchandise stores surged 1.1% (+5.4% y/y) but sales of furniture/home furnishings & electronics/appliances were unchanged (3.9% y/y) after a 1.1% decline in August that was deeper than the 0.4% decline initially reported.
Building materials, garden equipment & supply dealers' sales surged 1.4% (14.4% y/y).
Sales at gasoline service stations ticked up 0.1% (15.1% y/y) after two months of 0.1% decline. Retail gasoline prices fell in each of those months but in October they are up to $1.99/gallon versus an average $1.87 in September.
| Sept | Aug | Y/Y | 2003 | 2002 | 2001 | |
|---|---|---|---|---|---|---|
| Retail Sales & Food Services | 1.5% | -0.2% | 7.7% | 5.4% | 2.5% | 3.1% |
| Excluding Autos | 0.6% | 0.2% | 7.8% | 5.2% | 3.2% | 3.1% |
by Tom Moeller October 15, 2004
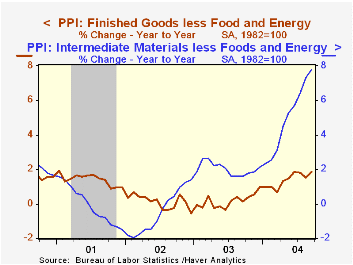
In September the finished goods PPI rose 0.1% and matched Consensus expectations. The gain followed slight decline in two of the prior three months. Less food & energy prices were a bit stronger, up 0.3%, versus expectations for a 0.2% rise.
"Core" finished consumer goods prices jumped 0.4% (2.0% y/y) on the strength of higher durable & nondurable goods prices.
Finished capital goods prices also registered a firm 0.4% (1.8% y/y) gain reflecting strength in prices of textile machinery as well as ships.
Finished energy prices fell 0.9% (9.1% y/y). Residential gas prices dropped a not seasonally adjusted 2.4% (5.7% y/y) but they have recovered in October.Gasoline prices rose a not seasonally adjusted 1.9% m/m (+18.9% y/y).
Crude prices less food & energy reversed some of the prior month's strength with a 2.5% decline. During the last thirty years "core" crude prices have been a fair indicator of activity in the industrial sector. There has been a 51% correlation between the six month change in core crude prices and the change in factory sector industrial production. Overall crude prices fell 4.2%, dragged lower by the 6.6% decline in crude energy costs.
Intermediate goods prices ticked just 0.1% higher but core intermediate prices added 0.7% to the 1.0% August jump. Industrial chemical prices continued strong.
Today's remarks on oil by Fed Chairman Alan Greenspan can be found here.
| Producer Price Index | Sept | Aug | Y/Y | 2003 | 2002 | 2001 |
|---|---|---|---|---|---|---|
| Finished Goods | 0.1% | -0.1% | 3.3% | 3.2% | -1.3% | 2.0% |
| Core | 0.3% | -0.1% | 1.9% | 0.2% | 0.1% | 1.4% |
| Intermediate Goods | 0.1% | 1.0% | 8.3% | 4.7% | -1.5% | 0.4% |
| Core | 0.7% | 1.0% | 7.8% | 2.0% | -0.5% | -0.1% |
| Crude Goods | -4.2% | -0.7% | 14.2% | 25.1% | -10.6% | 0.3% |
| Core | -2.5% | 4.5% | 25.4% | 12.4% | 3.8% | -10.0% |
by Tom Moeller October 15, 2004
The October Empire State Index of General Business Conditions in New York's manufacturing industries fell 9.8 points to 17.43 following a 14.04 point gain in September.
New orders and shipments both gave back some of the prior months' gains.The employment measure also fell. Like the Philadelphia Fed Index of General Business Conditions, the Empire State Business Conditions Index reflects answers to an independent survey question; it is not a weighted combination of the components.
The prices paid jumped to a record high of 59.17.
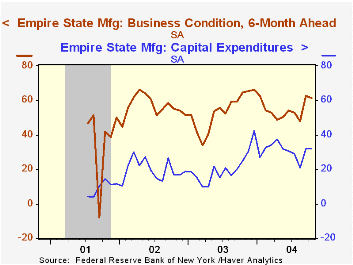
Expectations for business conditions six months fell modestly as did expectations for capital expenditures. 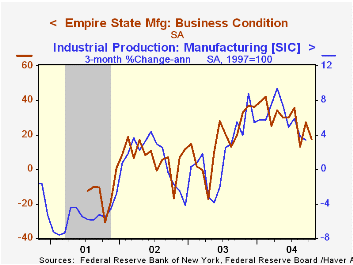
The Empire State Manufacturing Survey is a monthly survey of manufacturers in New York State conducted by the Federal Reserve Bank of New York. Participants from across the state in a variety of industries respond to a questionnaire and report the change in a variety of indicators from the previous month. Respondents also state the likely direction of these same indicators six months ahead. April 2002 is the first report, although survey data date back to July 2001.
For more on the Empire State Manufacturing Survey, including methodologies and the latest report, click here.
"What Can Regional Manufacturing Surveys Tell Us? - Lessons From the Tenth District" from the Federal Reserve Bank of Kansas City is available here.
| Empire State Manufacturing Survey | Oct | Sept | 10/03 | 2003 | 2002 | 2001 |
|---|---|---|---|---|---|---|
| General Business Conditions (diffusion index) | 17.43 | 27.26 | 20.20 | 16.30 | 7.02 | -13.57 |
by Tom Moeller October 15, 2004
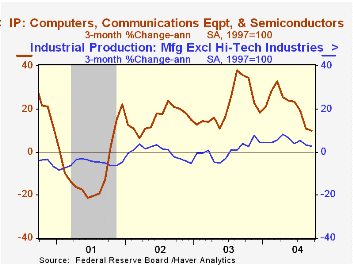
In September, industrial production rose just 0.2% following a downwardly revised 0.2% decline the prior month. Consensus expectations had been for a 0.4% September increase.
Production in the factory sector fell 0.3% (+5.3% y/y) last month following the modest 0.2% August gain.
Output fell broadly; motor vehicles (-0.4% m/m, -1.2% y/y), furniture (-0.6% m/m, +2.9% y/y), petroleum (-3.3% m/m, -0.3% y/y), and textiles (-0.9% m/m, -1.7% y/y).
The high tech sector was relatively firm posting a 1.0% (20.8% y/y) gain, however the prior month's strength was revised down and the sector's growth has been ebbing.Factory output excluding motor vehicles & high tech fell 0.3% (+4.8% y/y), the third down month in the last four (August was revised to a 0.2% decline).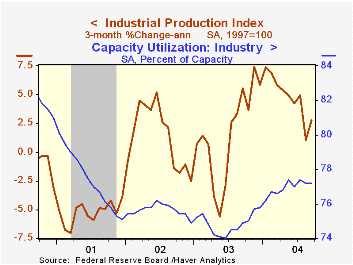
Total capacity utilization was stable at an upwardly revised 77.3%. Growth in capacity inched up to 1.4% y/y from 1.1% earlier this year.
| Production & Capacity | Aug | July | Y/Y | 2003 | 2002 | 2001 |
|---|---|---|---|---|---|---|
| Industrial Production | 0.2% | -0.2% | 4.7% | 0.3% | -0.6% | -3.4% |
| Capacity Utilization | 77.2% | 77.2% | 74.9%(9/03) | 74.8% | 75.6% | 77.4% |
by Tom Moeller October 15, 2004
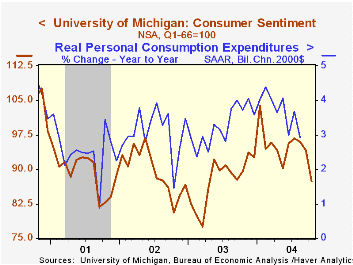
The Mid-October reading of consumer sentiment from the University of Michigan plunged 7.1% to 87.5 on the heels of declines during the prior two months. Consensus expectations for a reading of 95.0.
During the last ten years there has been a 75% correlation between the level of consumer sentiment and the y/y change in real PCE.
The War in Iraq, the higher price of gasoline and several hurricanes which buffeted Florida are the likely culprits behind the fall in sentiment.
The reading of current economic conditions fell a sharp 4.0%, about the same as in September, but it was consumer expectations that took a powder with a 9.5% drop.
The University of Michigan survey is not seasonally adjusted.The mid-month survey is based on telephone interviews with 250 households nationwide on personal finances and business and buying conditions. The survey is expanded to a total of 500 interviews at month end.
| University of Michigan | Mid-Oct | Sept | Y/Y | 2003 | 2002 | 2001 |
|---|---|---|---|---|---|---|
| Consumer Sentiment | 87.5 | 94.2 | -2.3% | 87.6 | 89.6 | 89.2 |
| Current Conditions | 99.6 | 103.7 | -0.3% | 97.2 | 97.5 | 100.1 |
| Consumer Expectations | 79.6 | 88.0 | -4.1% | 81.4 | 84.6 | 82.3 |
by Tom Moeller October 15, 2004
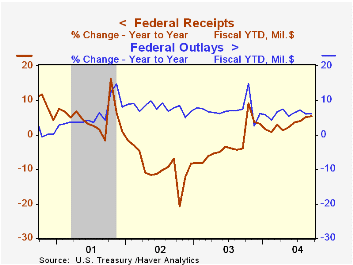
The US budget deficit at $413B for FY 2004 came in slightly below the latest Congressional Budget Office estimate of $422. The latest CBO deficit estimate for FY05 is $348B.
For FY04 the deficit of $412.6B was 9.4% larger than a year earlier. According to the Fed's Flow of Funds figures, through 2Q04 the growth in outstanding liabilities of the Federal government grew 10.6% y/y versus 7.4% growth in nonfederal liabilities.
Growth in net receipts improved late in the fiscal year raising the year's growth to 5.5% versus a 3.8% decline in FY03. Individual tax receipts jumped in September, as they often do, and pulled the FY04 total up 1.9% versus a decline of 7.5% last year. Corporate tax receipts also surged in September and rose 43.7% in FY04.
Growth in Federal net expenditures for FY04 eased slightly to 6.2% versus 7.4% growth in FY03. Defense expenditures actually grew a lesser 12.7% versus 15.9% growth last year. Growth in Medicare outlays was stable at 8.0 and interest expense grew 4.8% versus a 10.5% decline during last year. Outlays for income security fell 0.4% after as 7.5% rise in FY03 and growth in education & training outlays slowed to 6.8% from 16.5%.
"The Budget and Economic Outlook: An Update" from the Congressional Budget Office is available here.
| US Government Finance | Sept | Aug | Sept '03 | FY2004 | FY2003 | FY2002 |
|---|---|---|---|---|---|---|
| Budget Balance | $24.4B | $-41.1B | $23.4B | $-412.6B | $-377.1B | $-157.8B |
| Revenues | $207.4B | $137.7B | 8.2% | 5.5% | -3.8% | -6.9% |
| Outlays | $183.0B | $178.9B | 8.8% | 6.2% | 7.4% | 7.9% |

Tom Moeller
AuthorMore in Author Profile »Prior to joining Haver Analytics in 2000, Mr. Moeller worked as the Economist at Chancellor Capital Management from 1985 to 1999. There, he developed comprehensive economic forecasts and interpreted economic data for equity and fixed income portfolio managers. Also at Chancellor, Mr. Moeller worked as an equity analyst and was responsible for researching and rating companies in the economically sensitive automobile and housing industries for investment in Chancellor’s equity portfolio. Prior to joining Chancellor, Mr. Moeller was an Economist at Citibank from 1979 to 1984. He also analyzed pricing behavior in the metals industry for the Council on Wage and Price Stability in Washington, D.C. In 1999, Mr. Moeller received the award for most accurate forecast from the Forecasters' Club of New York. From 1990 to 1992 he was President of the New York Association for Business Economists. Mr. Moeller earned an M.B.A. in Finance from Fordham University, where he graduated in 1987. He holds a Bachelor of Arts in Economics from George Washington University.
More Economy in Brief


