 Global| Jul 16 2008
U.S. Consumer Price Index Jumped 1.1%, Y/Y Gain The Most Since 1991
by:Tom Moeller
|in:Economy in Brief
Summary
The June consumer price index (CPI-U), as reported by the Bureau of Labor Statistics, jumped 1.1% after May's 0.6% rise. The increase, fueled by higher energy prices, was the strongest since October 2005 and it lifted the y/y increase [...]
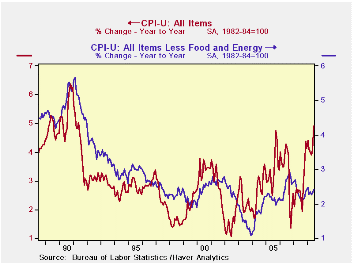
The June consumer price index (CPI-U), as reported by the Bureau of Labor Statistics, jumped 1.1% after May's 0.6% rise. The increase, fueled by higher energy prices, was the strongest since October 2005 and it lifted the y/y increase to 4.9%, its strongest since 1991. Consensus expectations had been for a 0.7% increase for last month.
Energy prices jumped 6.6% in June after the 4.4% surge during May. Gasoline prices spiked a seasonally adjusted 10.1% and were up 32.8% y/y. (Not seasonally adjusted gasoline prices rose 7.9% m/m last month and they are up another 1.5% so far in July.) Fuel oil prices also were quite strong and surged 8.5% (61.2% y/y). Natural gas & electricity prices rose 1.5% (10.1% y/y).
Food & beverage prices were strong
again and jumped 0.7%. That lifted the y/y gain of 5.2% to its fastest
since 1990. The three-month rate of increase jumped to an even firmer
8.1%. Prices for cereals & bakery products rose at a 15.2% rate
during the last three months while dairy and related products increased
at an 11.1% rate. Prices for meats poultry & fish showed upward
pressure lately and rose at a 7.8% rate while dairy product prices
surged at an 11.1% rate.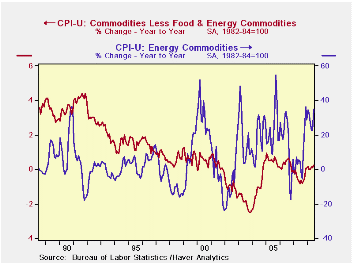
Less food & energy consumer prices again matched expectations and rose 0.2%, the same as during May. During the last three months core prices rose at a 2.5% annual rate, the quickest since January.
Core goods prices offset May's slip and
nudged up 0.1%. On a the three-month basis prices nudged lower at a
0.1% rate. Prices for new & used motor vehicles rose 0.1% in
June but are down at a 0.7% annual rate during the last three months.
Apparel prices also ticked up 0.1% and, together with a firm 0.5% gain
in April, was enough to lift the three month increase to 1.0%, its
firmest since January. Prices for household furnishings &
operations were unchanged. They posted a 0.5% uptick during the last
three months versus a 0.1% decline during all of last year.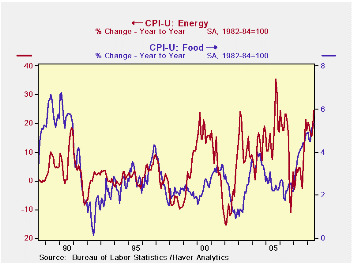
Core services prices posted 0.4% increase, which was the largest rise since January, and it lifted the three month growth rate to 3.6%. The strength again was led by a 3.4% (13.4% y/y) surge in public transportation prices and they are up at a 23.6% rate during the last three months. Medical care services prices rose a reduced 0.3% (4.6% y/y) and shelter prices increased 0.3% (2.6% y/y). Owners equivalent rent of primary residence, a measure not equivalent to other house price measures, rose 0.3% (2.6% y/y) and rents rose 0.4% (3.7% y/y). Education costs rose another 0.5% and here prices rose at an accelerated 5.1% rate during the last three months following a 2.4% rise during 2007.
The chained CPI, which adjusts for shifts in consumption patterns, rose a faster 0.8%. Less food and beverages chained prices rose 0.1%.
PCE and CPI Inflation Differentials: Converting Inflation Forecasts from the Federal Reserve Bank of Kansas City can be fund here.
Has the Behavior of Inflation and Long-term Inflation Expectations Changed? also from the Federal Reserve Bank of Kansas City is available here.
| Consumer Price Index (%) | June | May | June Y/Y | 2007 | 2006 | 2005 |
|---|---|---|---|---|---|---|
| Total | 1.1 | 0.6 | 4.9 | 2.9 | 3.2 | 3.4 |
| Total less Food & Energy | 0.3 | 0.2 | 2.4 | 2.3 | 2.5 | 2.2 |
| Goods less Food & Energy | 0.1 | -0.1 | 0.2 | -0.4 | 0.2 | 0.5 |
| Services less Energy | 0.4 | 0.3 | 3.3 | 3.4 | 3.4 | 2.8 |
| Energy | 6.6 | 4.4 | 24.4 | 5.6 | 11.0 | 17.0 |
| Food & Beverages | 0.8 | 0.3 | 5.3 | 4.0 | 2.3 | 2.5 |
| Chained CPI: Total (NSA) | 0.8 | 0.6 | 4.2 | 2.5 | 2.9 | 2.9 |
| Total less Food & Energy | 0.1 | 0.0 | 2.1 | 2.0 | 2.2 | 1.9 |
by Tom Moeller July 16, 2008
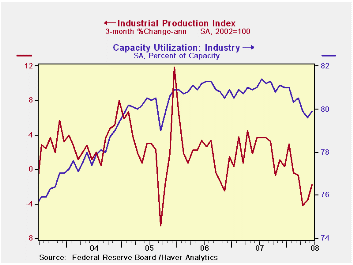
Industrial production recovered unexpectedly by 0.5% last month, but the gain was due mostly to warmer temperatures. The rise followed an unrevised 0.2% decline during May. Consensus expectations had been for no change in output last month.
Warmer temperatures lifted utility output by 2.1% during June and that offset the decline during May.
Factory output also was better than expected and rose 0.2% following an unrevised flat reading during May. The three-month rate change, however, remained negative at -3.1% (AR).
Production in the high tech sector again was firm and rose
1.8% (23.6% y/y). Production of computers & office equipment
rose 0.8% (14.7% y/y) but the three-month growth rate slowed further to
3.7% (AR). Output of communications equipment jumped 1.6% and
three-month growth totaled 18.4%.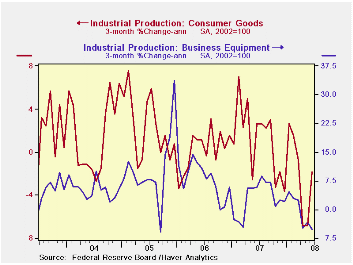
The trend in output outside the high-tech sector has been decidedly weak. Less high-tech, factory output rose all of 0.2% last month and three-month output growth remained a negative 4.1% (AR). Output of motor vehicles & parts did rise 5.4% in June but three-month growth was still low at -4.0%. June output of furniture fell 0.4% and at an 8.1% rate during the last three months. Electrical equipment rose at a 4.2% rate during the last three months. Machinery output continued to decline sharply at a 14.7% annual rate during the last three months.
In the nondurables area, output of apparel recovered 1.3% in June but it was still down at a 3.1% rate during the last three months.
Capacity utilization increased to 79.9% from an upwardly revised 79.6% during May. Utilization in the factory sector, however, was unchanged at 77.6%, near its lowest also since late-2004.
Speculative Bubbles and Overreaction to Technological Innovation from the Federal Reserve Bank of San Francisco can be found here.
| INDUSTRIAL PRODUCTION (SA) | June | May | Y/Y | 2007 | 2006 | 2005 |
|---|---|---|---|---|---|---|
| Total | 0.5 | -0.2 | 0.3 | 1.7 | 2.2 | 3.3 |
| Manufacturing | 0.2 | 0.0 | -0.6 | 1.7 | 2.4 | 4.0 |
| Consumer Goods | 0.8 | -0.2 | -0.8 | 1.7 | 0.3 | 2.8 |
| Business Equipment | 0.2 | 0.2 | 1.6 | 3.3 | 10.4 | 7.3 |
| Construction Supplies | -0.8 | 0.4 | -6.2 | -2.5 | 2.2 | 4.5 |
| Utilities | 2.1 | -2.1 | 4.0 | 3.3 | -0.6 | 2.1 |
by Robert Brusca July 16, 2008
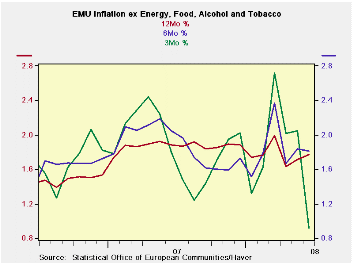 Although the ECB policy remains steadfastly fixed on the
behavior of the HICP headline, it is the HICP core that is showing
signs of behaving. The six month pace of the core at 2.3% is as low as
it has been since Oct 2007 (eight months ago). The three-month pace at
1.3% is as low as that metric has been since March of 2006 (twenty
seven months ago). The trends may be too good to be true or even
lasting but for now they are a note of optimism in an otherwise rotten
policy environment. Moreover I think their message is the right one.
Although the ECB policy remains steadfastly fixed on the
behavior of the HICP headline, it is the HICP core that is showing
signs of behaving. The six month pace of the core at 2.3% is as low as
it has been since Oct 2007 (eight months ago). The three-month pace at
1.3% is as low as that metric has been since March of 2006 (twenty
seven months ago). The trends may be too good to be true or even
lasting but for now they are a note of optimism in an otherwise rotten
policy environment. Moreover I think their message is the right one.
Headline inflation, the ostensible ECB target rate, is not supposed to rise more that 2% Y/Y. I fact the headline pace has not been below 2% since August of 2007. The current pace is 4.0% double the targeted top pace.
However the sharp drop in the Zew index this week has everyone in Europe thinking about coming weakness. This may be one reason that oil prices finally became vulnerable on Mr Bernanke’s remarks yesterday, as oil fell an outsized $6/bbl.
There has been a certain denial of the transmission of the US business cycle to Europe and to the rest of the world. But with so many benefiting from US demand it is hard to understand where that view originated. Europeans seemed to foster a view of newfound invincibility but the jump in inflation has undermined that. And the view itself helped the euro to climb to new heights, but now there is evidence of growth fading more severely and that will test the ECB and likely bring the euro down a notch or two.
While the ECB does not make the core HICP the centerpiece of policy the fact that core inflation has decelerated to 1.3% over three months from 2.3% over six months and 2.5% over 12-months seems to say that there is some progress on the inflation front apart for the headline where oil especially is wreaking such havoc. The ECB does have some authentic scope to be a bit pragmatic on the inflation front due to the kind trend in core inflation. A weakening economy will give it more lee way still.
| Trends in HICP | |||||||
|---|---|---|---|---|---|---|---|
| % mo/mo | % saar | ||||||
| Jun-08 | May-08 | Apr-08 | 3-Mo | 6-Mo | 12-Mo | Yr Ago | |
| EMU-13 | 0.5% | 0.6% | 0.0% | 4.1% | 4.1% | 4.0% | 1.9% |
| Core | 0.2% | 0.2% | -0.1% | 1.3% | 2.3% | 2.5% | 1.9% |
| Goods | 0.4% | 0.8% | 0.6% | 7.6% | 6.0% | 4.9% | 1.5% |
| Services | 0.3% | 0.4% | -0.1% | 2.2% | 2.5% | 2.5% | 2.6% |
| HICP | |||||||
| Germany | 0.5% | 0.6% | -0.4% | 2.7% | 3.2% | 3.4% | 2.0% |
| France | 0.5% | 0.5% | 0.1% | 4.5% | 4.0% | 4.0% | 1.3% |
| Italy | 0.6% | 0.4% | 0.0% | 4.2% | 4.6% | 4.0% | 1.9% |
| Spain | 0.6% | 0.7% | -0.1% | 4.9% | 4.5% | 5.0% | 2.4% |
| Core excl Food Energy & Alcohol | |||||||
| Germany | 0.1% | 0.3% | -0.5% | -0.4% | 0.8% | 1.8% | 2.1% |
| France | #N/A | 0.1% | 0.1% | #N/A | #N/A | #N/A | 1.4% |
| Italy | 0.4% | 0.2% | -0.1% | 1.9% | 3.1% | 3.0% | 1.9% |
| Spain | 0.3% | 0.3% | -0.1% | 2.2% | 2.6% | 3.4% | 2.5% |

Tom Moeller
AuthorMore in Author Profile »Prior to joining Haver Analytics in 2000, Mr. Moeller worked as the Economist at Chancellor Capital Management from 1985 to 1999. There, he developed comprehensive economic forecasts and interpreted economic data for equity and fixed income portfolio managers. Also at Chancellor, Mr. Moeller worked as an equity analyst and was responsible for researching and rating companies in the economically sensitive automobile and housing industries for investment in Chancellor’s equity portfolio. Prior to joining Chancellor, Mr. Moeller was an Economist at Citibank from 1979 to 1984. He also analyzed pricing behavior in the metals industry for the Council on Wage and Price Stability in Washington, D.C. In 1999, Mr. Moeller received the award for most accurate forecast from the Forecasters' Club of New York. From 1990 to 1992 he was President of the New York Association for Business Economists. Mr. Moeller earned an M.B.A. in Finance from Fordham University, where he graduated in 1987. He holds a Bachelor of Arts in Economics from George Washington University.
More Economy in Brief


