 Global| Jun 13 2008
U.S. Consumer Price Index Acceleration Driven by Energy
by:Tom Moeller
|in:Economy in Brief
Summary
The Bureau of Labor Statistics reported that the May consumer price index (CPI-U) rose 0.6%. The increase was the strongest since last November and it was slightly ahead of expectations for a 0.5% rise. Year-to-year, prices rose 4.1% [...]
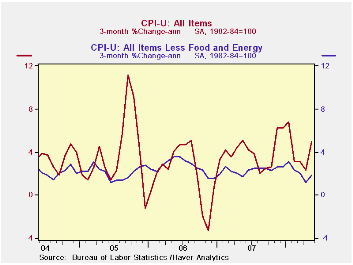
The Bureau of Labor Statistics reported that the May consumer price index (CPI-U) rose 0.6%. The increase was the strongest since last November and it was slightly ahead of expectations for a 0.5% rise. Year-to-year, prices rose 4.1% but during the last three months the increase has been a faster 4.9%.
Energy prices surged 4.4% last month, the
gain lifted by a 5.7% (20.8% y/y) seasonally adjusted jump in gasoline
prices. (Not seasonally adjusted gasoline prices rose 9.5% m/m last
month and are up another 6.4% so far in June.) Fuel oil prices more
than doubled the April rise and increased 7.9% (50.7% y/y). Natural gas
& electricity prices also were strong and rose 2.3% (8.8% y/y).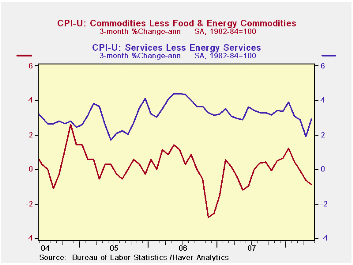
Food & beverage prices continued to rise and posted a 0.3% increase. The year-to-year increase was stable at a firm 5.0% which was the strongest since 1990, but the three-month rate of increase is an even firmer 5.9%. Prices for cereals & bakery products led last month's strength with a 1.6% (10.5% y/y) jump. Other food prices were under control. Prices for meats poultry & fish rose 0.1% (2.6% y/y) after a 0.9% April increase. Dairy product prices also cooled and fell 0.1% after the 1.2% spike during April. Prices still were up 11.0% y/y.
Less food & energy, consumer prices
matched expectations and increased 0.2% during May after a 0.1% April
uptick. During the last three months this inflation measure rose at a
1.8% annual rate, down from the 2.3% gain last year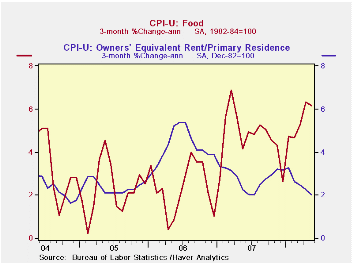
Core goods prices fell 0.1% after having been unchanged in April. The three-month rate of decline of 0.9% was the weakest showing for core prices since May of last year. Prices for new & used motor vehicles fell 0.1% and declined at a 1.5% rate during the last three months. Apparel prices also were weak. They declined 0.3% and fell at a 4.3% annual rate during the last three months. Prices for household furnishings & operations rose just 0.2% but lately have shown some strength. They posted a 2.7% gain during the last three months versus a 0.1% decline during all of last year.
Core services prices firmed last month and posted 0.3% increase which was the largest rise since January. The strength was led by a 2.3% (10.2% y/y) surge in public transportation prices. Medical care services prices also rose a strong 0.5% (4.7% y/y). Still tame were shelter prices which rose 0.2% (2.6% y/y). Owners equivalent rent of primary residence, a measure not equivalent to other house price measures, rose 0.1% (2.6% y/y) and rents rose 0.2% (3.5% y/y). Education costs rose another 0.4% and here prices rose at an accelerated 4.2% rate during the last three months following a 2.4% rise during 2007.
The chained CPI, which adjusts for shifts in consumption patterns, rose 0.6% which was near the April increase. Less food and beverages chained prices were unchanged.
Does stabilizing inflation contribute to stabilizing economic activity? is a speech by Fed Governor Frederic S. Mishkin and it can be found here.
| Consumer Price Index (%) | May | April | March | May Y/Y | 2007 | 2006 | 2005 |
|---|---|---|---|---|---|---|---|
| Total | 0.6 | 0.2 | 0.3 | 4.1 | 2.9 | 3.2 | 3.4 |
| Total less Food & Energy | 0.2 | 0.1 | 0.2 | 2.3 | 2.3 | 2.5 | 2.2 |
| Goods less Food & Energy | -0.1 | 0.0 | -0.1 | 0.1 | -0.4 | 0.2 | 0.5 |
| Services less Energy | 0.3 | 0.1 | 0.2 | 3.2 | 3.4 | 3.4 | 2.8 |
| Energy | 4.4 | -0.0 | 1.9 | 16.9 | 5.6 | 11.0 | 17.0 |
| Food & Beverages | 0.3 | 0.9 | 0.2 | 5.0 | 4.0 | 2.3 | 2.5 |
| Chained CPI: Total (NSA) | 0.6 | 0.5 | 0.8 | 3.6 | 2.5 | 2.9 | 2.9 |
| Total less Food & Energy | 0.0 | 0.1 | 0.5 | 2.0 | 2.0 | 2.2 | 1.9 |
by Tom Moeller June 13, 2008
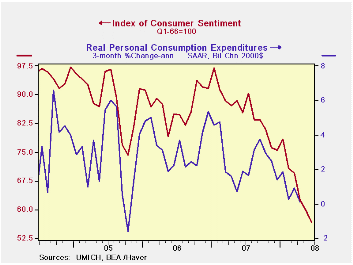
The preliminary reading of June consumer sentiment from the University of Michigan fell 5.4% from May to a level of 56.7. The decline was greater-than-expected and it pulled sentiment 41.5% below the latest peak in early-2007.
During the last ten years there has been a 47% correlation
between the level of sentiment and the three month change in real
consumer spending.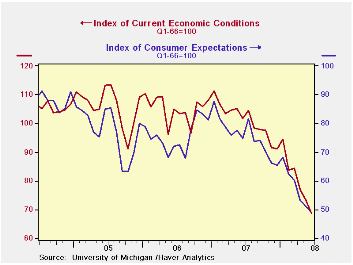
The June current conditions index dropped 6.3% after a 4.8% decline. This index is down 38.3% from early 2007. The view of current personal finances plummeted 18.8% (-40.9% y/y). Conversely, the index of whether now is a good time to buy large household goods improved by 1.8% (-27.9% y/y).
The expectations component of overall sentiment dropped the same 4.1% as it did in May. The index fell to its lowest level since late-1990. Expectations for personal finances dropped sharply to the lowest level since 1980 while expectations for business conditions during the next five years also fell sharply to the lowest level since 1991.
Opinions about government policy, which apparently influence
economic expectations, reversed the May plummet and the index increased
23.5%. The percentage of those surveyed who indicated that they thought
government was doing a good job recovered to all of 8% of respondents
and a fewer 45% thought a poor job was being done versus 55% in May.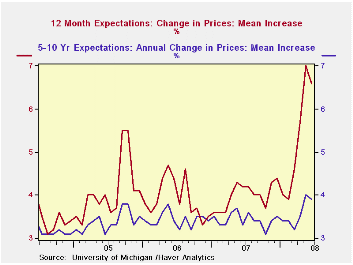
The mean expected rate of inflation during the next twelve months fell to 6.6% after the surge last month to 7.0%. During the next five years the expected inflation rate slipped to 3.9%.
The University of Michigan survey is not seasonally adjusted.The reading is based on telephone interviews with about 500 households at month-end; the mid-month results are based on about 300 interviews. The summary indexes are in Haver's USECON database, with details in the proprietary UMSCA database.
| University of Michigan | June (Prelim.) | May | April | June y/y | 2007 | 2006 | 2005 |
|---|---|---|---|---|---|---|---|
| Consumer Sentiment | 56.7 | 59.8 | 62.6 | -33.5% | 85.6 | 87.3 | 88.5 |
| Current Conditions | 68.7 | 73.3 | 77.0 | -32.6% | 101.2 | 105.1 | 105.9 |
| Expectations | 49.0 | 51.1 | 53.3 | -34.4% | 75.6 | 75.9 | 77.4 |
by Robert Brusca June 13, 2008
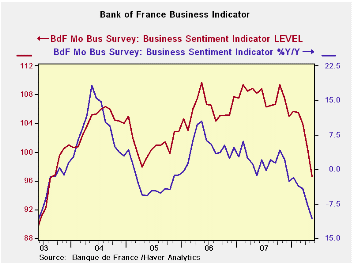
The Bank of France business indicator fell to 97 from 100.4 in May. After seeing the result the Bank of France cut its growth estimate for GDP to +0.2% down from +0.3% previously for the Q/Q gain. In the latest month production was weak. The survey respondents rated it in the bottom one percent of all production ratings since 1988. Even capital equipment was rated as low in the month.
The production outlook fared better with roughly mid-range rankings. Capital goods and consumer goods were particularly strong, above their range mid-points. The consumer goods ranking was in the top 14% of its historic range – a surprisingly strong result.
Demand was rated as solid overall with overall order books assessed as being above their range point in the top 40% of their range. But FOREIGN order books were assessed as very low, in the bottom 4% of its range.
New orders are mixed but weak. Total orders are in the bottom 6% of their range. Capital goods new orders were in the bottom quarter of their range. Consumer goods were in the 47th range percentile, nearly at neutral.
Stocks of goods on hand are mid range or higher as for capital goods and autos. Capacity use is rated as low, a bottom third of range response. Hiring, last month, was in the 33rd percentile of its range; the outlook is still much stronger, in its 80th percentile.
About the ranking percentiles: To derive the ranking percentiles we rank the various components from Jan 1988 to date then express the rank as a percentile of the total with 10% being strong and zero % weak. Ranking percentiles are a bit more useful than range percentiles because they place an observation in a ranking queue instead of being influenced by only the range extremes of high and low as with range percentiles. A bottom 23.7% ranking is a ranking is in the bottom twenty-three percent (bottom quarter of the range) of all readings since 1988.
| Bank of France Monthly INDUSTRY Survey | ||||||
|---|---|---|---|---|---|---|
| Since Jan-87 | Ranking | |||||
| May-08 | Apr-08 | Mar-08 | 12-MO AVERAGE | Average | Percentile | |
| Production-latest mo | ||||||
| Total Industry | -12.41 | 2.44 | -0.22 | 4 | 7 | 0.8% |
| Semi-Finished | -15.57 | 7.01 | -4.1 | 4 | 6 | 0.8% |
| Capital | -9.09 | 11.17 | 1.36 | 8 | 7 | 4.5% |
| Auto | -29.94 | -13.88 | -3.31 | -4 | 7 | 6.1% |
| Consumer | -6.5 | 0.87 | 3.67 | 7 | 8 | 2.9% |
| Agricultural & Food | 0.32 | -8.28 | 1.94 | 4 | 10 | 9.8% |
| Production Outlook | ||||||
| Total Industry | 14.51 | 6.02 | 14.13 | 15 | 15 | 43.7% |
| Semi-Finished | 12.55 | 3.55 | 10.84 | 14 | 13 | 46.1% |
| Capital | 18.86 | 13.35 | 19.97 | 20 | 17 | 50.2% |
| Auto | 16.63 | 12.77 | 14.39 | 17 | 15 | 47.3% |
| Consumer | 22.95 | -7.77 | 16.03 | 12 | 17 | 86.9% |
| Agric&Food | 3.54 | 8.23 | 9.49 | 13 | 17 | 0.8% |
| Demand | ||||||
| Overall order books | 12.1 | 16.01 | 17.7 | 24 | 5 | 59.2% |
| Foreign Orders | -7.36 | 10.21 | 2.1 | 8 | 8 | 4.5% |
| New Orders | ||||||
| Total Industry | -4.65 | 8.46 | 1.59 | 8 | 9 | 6.1% |
| Semi-Finished | -8.92 | 0.9 | -0.27 | 6 | 7 | 9.0% |
| Capital | 3.69 | 14.81 | 5.4 | 10 | 9 | 25.7% |
| Auto | -- | -- | -- | -- | -- | -- |
| Consumer | 10.63 | 9.18 | 7.8 | 13 | 11 | 47.8% |
| Agric&Food | -3.13 | -6.77 | -0.44 | 5 | 11 | 5.7% |
| Stocks: Finished Gds | ||||||
| Total Industry | -1.72 | 0.71 | 0.66 | -2 | -2 | 48.6% |
| Semi-Finished | -4.82 | -1.43 | -2.28 | -2 | -2 | 20.4% |
| Capital | -1.29 | -0.12 | -3.97 | -2 | -3 | 64.9% |
| Auto | 4.85 | 10.82 | 17.42 | -2 | -3 | 75.1% |
| Consumer | 0.19 | 1.23 | 2.19 | -1 | 0 | 44.9% |
| Agricultural & Food | -0.21 | 12.17 | 0.33 | 1 | 0 | 46.1% |
| Capacity Utilization | 82.04 | 83 | 82.99 | 83 | 83 | 31.8% |
| Hiring | ||||||
| Latest Mo | -4.39 | -0.55 | -2.58 | -1 | -1 | 33.5% |
| Outlook | -3.38 | -2.96 | -3.88 | -2 | -3 | 80.8% |
| Industry Sentiment Index | 96.65 | 100.4 | 103.91 | 105 | 106 | 23.7% |
| Ranges, percentiles since January of 1988 | ||||||

Tom Moeller
AuthorMore in Author Profile »Prior to joining Haver Analytics in 2000, Mr. Moeller worked as the Economist at Chancellor Capital Management from 1985 to 1999. There, he developed comprehensive economic forecasts and interpreted economic data for equity and fixed income portfolio managers. Also at Chancellor, Mr. Moeller worked as an equity analyst and was responsible for researching and rating companies in the economically sensitive automobile and housing industries for investment in Chancellor’s equity portfolio. Prior to joining Chancellor, Mr. Moeller was an Economist at Citibank from 1979 to 1984. He also analyzed pricing behavior in the metals industry for the Council on Wage and Price Stability in Washington, D.C. In 1999, Mr. Moeller received the award for most accurate forecast from the Forecasters' Club of New York. From 1990 to 1992 he was President of the New York Association for Business Economists. Mr. Moeller earned an M.B.A. in Finance from Fordham University, where he graduated in 1987. He holds a Bachelor of Arts in Economics from George Washington University.
More Economy in Brief


