 Global| Oct 07 2008
U.S. Consumer Credit Usage Decline Unprecedented
by:Tom Moeller
|in:Economy in Brief
Summary
During August, consumer credit outstanding dropped as it never has before. The $7.9 billion m/m decline was by far the largest in the series' postwar history. On a percentage basis, credit outstanding did fall a more moderate 0.3%, [...]
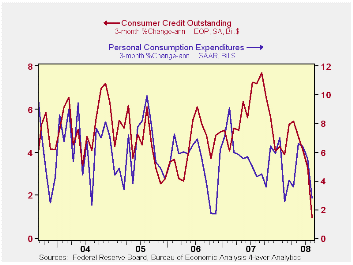
During August, consumer credit outstanding dropped as it never has before. The $7.9 billion m/m decline was by far the largest in the series' postwar history. On a percentage basis, credit outstanding did fall a more moderate 0.3%, but even that represented one of larger declines in the series' history. It is nearly unprecedented for a non-recessionary period.
Over the last three months, growth in consumer credit outstanding averaged just 1.0% (AR). Before August that growth averaged between 3% and 5% after the 2007 gain of 5.8%. The decline in growth was necessitated by less spending on consumer durables. The three month growth in nominal PCE for durable goods during the last three months cycled down to -12.4% from 2.9% positive growth during all of last year.
Non-revolving credit, which accounts for nearly two-thirds of total consumer credit, led the decline in borrowing with a $7.3B drop. Except for one month in early 1977, the dollar drop was unprecedented and on a percentage basis the 0.5% decline was one of the larger ones. On a three month basis, annualized growth fell to zero after a 4.7% rise last year and 3.6% growth during 2006.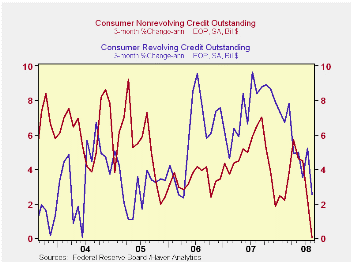
Revolving credit outstanding dropped a more modest $0.6B during August. While declines outside of past recessionary periods are rare, they are not unprecedented. And though they didn't exactly throw their credit cards away, consumers were much more frugal using them. Three month growth fell to 2.6%, down by two thirds from the 7.4% growth last year.
These figures are the major input to the Fed's Flow of Funds accounts for the household sector, released quarterly.
The minutes to the latest meeting of the FOMC can be found here.
| Consumer Credit (m/m Chg, SAAR) | August | July | Y/Y | 2007 | 2006 | 2005 |
|---|---|---|---|---|---|---|
| Total | $-7.9B | $5.2B | 3.8% | 5.8% | 4.5% | 4.3% |
| Revolving | $-0.6B | $4.0B | 5.7% | 7.4% | 6.1% | 3.1% |
| Non-revolving | $-7.3B | $1.2B | 2.7% | 4.7% | 3.6% | 4.9% |

Tom Moeller
AuthorMore in Author Profile »Prior to joining Haver Analytics in 2000, Mr. Moeller worked as the Economist at Chancellor Capital Management from 1985 to 1999. There, he developed comprehensive economic forecasts and interpreted economic data for equity and fixed income portfolio managers. Also at Chancellor, Mr. Moeller worked as an equity analyst and was responsible for researching and rating companies in the economically sensitive automobile and housing industries for investment in Chancellor’s equity portfolio. Prior to joining Chancellor, Mr. Moeller was an Economist at Citibank from 1979 to 1984. He also analyzed pricing behavior in the metals industry for the Council on Wage and Price Stability in Washington, D.C. In 1999, Mr. Moeller received the award for most accurate forecast from the Forecasters' Club of New York. From 1990 to 1992 he was President of the New York Association for Business Economists. Mr. Moeller earned an M.B.A. in Finance from Fordham University, where he graduated in 1987. He holds a Bachelor of Arts in Economics from George Washington University.
More Economy in Brief


