 Global| Mar 08 2010
U.S. Consumer Credit Records FirstIncrease in Year
by:Tom Moeller
|in:Economy in Brief
Summary
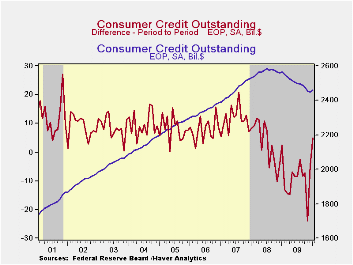
Consumer credit outstanding during January posted its first gain in twelve months. Is a bottom to the year-long retrenchment in the making or will debt-laden balance sheets force further cutbacks? The $5.0B gain in credit reported by [...]
 Consumer
credit outstanding during January posted its first gain in twelve
months. Is a bottom to the year-long retrenchment in the making or will
debt-laden balance sheets force further cutbacks? The $5.0B gain in
credit reported by the Federal Reserve late-Friday was the first
monthly increase in a year and reversed December's $4.6B decline. This
two-month flattening of credit usage follows a record $23.9B November
shortfall. Also a record, year-to-year credit outstanding fell 4.2%.
During the last ten years, there has been a two-thirds correlation
between the y/y change in credit outstanding and the change in personal
consumption expenditures. The January increase contrasted with
Consensus expectations for a $4.5B drop.
Consumer
credit outstanding during January posted its first gain in twelve
months. Is a bottom to the year-long retrenchment in the making or will
debt-laden balance sheets force further cutbacks? The $5.0B gain in
credit reported by the Federal Reserve late-Friday was the first
monthly increase in a year and reversed December's $4.6B decline. This
two-month flattening of credit usage follows a record $23.9B November
shortfall. Also a record, year-to-year credit outstanding fell 4.2%.
During the last ten years, there has been a two-thirds correlation
between the y/y change in credit outstanding and the change in personal
consumption expenditures. The January increase contrasted with
Consensus expectations for a $4.5B drop.
Increased usage of
non-revolving credit (autos & other consumer durables), which
accounts for nearly two-thirds of the total, accounted for the January
increase. 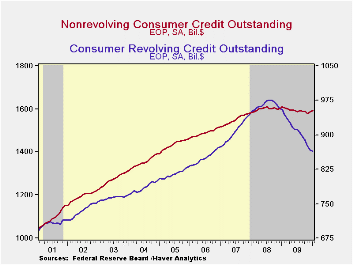 The $6.6B rise followed a $4.9B December increase. Together
they recouped November's drop and since mid-2008 the trend in usage's
level has been sideways. Federal government & Sallie Mae
lending expanded by more than two-thirds y/y during January. That
increase offset an 11.5% decline in pools of securitized assets, a 0.3%
slip in commercial bank lending and a 1.2% fall in credit union
lending.
The $6.6B rise followed a $4.9B December increase. Together
they recouped November's drop and since mid-2008 the trend in usage's
level has been sideways. Federal government & Sallie Mae
lending expanded by more than two-thirds y/y during January. That
increase offset an 11.5% decline in pools of securitized assets, a 0.3%
slip in commercial bank lending and a 1.2% fall in credit union
lending.
Continued cutting of revolving credit usage in January held back the increase in overall credit usage. It fell $1.7B following much sharper declines through most of 2009. The latest was part of a record 9.6% y/y decline. Versus January 2009 finance companies lowered lending by one-quarter, commercial bank lending fell 10.8%, pools of securitized assets fell 8.8% while savings institutions pulled lending back 1.0% y/y. Loans from credit unions offset some of these declines with a 5.4% increase.
These figures are the major input to the Fed's quarterly Flow of Funds accounts for the household sector.
Credit data are available in Haver's USECON database. The Flow of Funds data are in Haver's FFUNDS database.
Stressed, Not Frozen: The Federal Funds Market in the Financial Crisis from the Federal Reserve Bank of New York can be found here here.
| Consumer Credit Outstanding (m/m Chg, SAAR) | January | December | November | Y/Y | 2009 | 2008 | 2007 |
|---|---|---|---|---|---|---|---|
| Total | $5.0B | $-4.6B | $-23.9B | -4.2% | -4.3% | 1.5% | 5.7% |
| Revolving | $-1.7B | $-9.4B | $-13.7B | -9.6% | -9.6% | 1.6% | 8.1% |
| Non-revolving | $6.6B | 4.9B | $-10.2B | -1.0% | -1.1% | 1.5% | 4.4% |
by Robert Brusca March 8, 2010
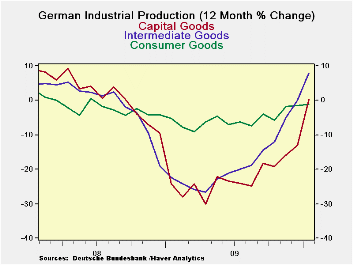
The sharp German recovery in the Yr/Yr growth of industrial production is being led by an upsurge in intermediate goods output. Capital goods output is rising briskly as well. Consumer goods continue to make snail’s pace progress. Only intermediate goods output is rising Yr/Yr to any significant degree, but capital goods output now has broken that threshold as well. Still, on a different venue all this is turned upside down.
Although the Yr/Yr rise in IP seems to have strong acceleration across sectors this is NOT confirmed by the sequential growth rates that look at annualized rates of growth over telescoped periods. The table shows that the annualized growth rate over three months for overall IP is just 1.3%, down from 6.8% over six months and below the Yr/Yr rate of 2.1%.Capital goods and intermediate goods output have decelerated sharply over three months compared to six months. But consumer goods output surprisingly is in a sharp accelerating phase with growth at a 12% pace over three months compared to an 8% pace over six months and to -1.2% Yr/Yr.
In the brand new quarter consumer output is rising at an 8.8% annual rate along with intermediate goods where output is up at a strong 5% pace. Capital goods output is falling by 3.2% early in 2010-Q1. Of course the best news for the sector is that orders have stepped up their pace in January after a period of meandering weakness. So whatever hint of slowing or erratic movement we see in the industrial production report, the sector seems to be well underpinned by new orders so that IP growth should continue to be strong in the months to come.
| Total German IP | |||||||
|---|---|---|---|---|---|---|---|
| Saar exept m/m | Jan-10 | Dec-09 | Nov-09 | 3-mo | 6-mo | 12-mo | Quarter to-Date |
| IP total | 0.6% | -1.0% | 0.7% | 1.3% | 6.8% | 2.1% | 1.0% |
| Consumer | -0.1% | 1.6% | 1.3% | 11.9% | 8.2% | -1.2% | 8.8% |
| Capital | -1.0% | 0.3% | 0.7% | 0.0% | 8.1% | 0.2% | -3.2% |
| Intermed | 3.3% | -4.1% | 1.3% | 1.2% | 11.5% | 7.9% | 5.0% |
| Memo | |||||||
| Construction | -14.3% | -2.0% | 0.6% | -49.2% | -28.2% | -9.4% | -63.1% |
| MFG IP | 0.9% | -1.2% | 0.9% | 2.5% | 9.3% | 3.6% | 2.5% |
| MFG Orders | 4.3% | -1.6% | 0.0 | 23.7% | 14.2% | 19.7% | 27.5% |
by Louise Curley March 8, 2010
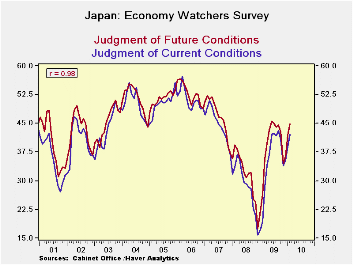
Economy Watchers in Japan found current business conditions improving in February for the third successive month. The diffusion index rose 8.5% from 38.8% in January to 42.1% in February. The index was more than twice--a 117.0% increase over--that of a year ago. The index for the total has almost recovered from the big drop last November as can be seen in the attached chart.
Current conditions in all the components improved in February as can be seen in the table below and, like the total, were substantially above February 2009. Eating and Drinking establishments and retail sales showed growth above the average in February. Substantial improvements were also found in the corporate sector and in employment The Current conditions index for Non manufacturing corporations increased 10.5% between January and February and was 164.4% above the February 2009 index. Comparable figures for manufacturing corporations were 6.9% and 161.6%. The diffusion index for employment increased 8.4% in February from January and was over 300% above February, 2009.
The Economy Watchers' overall appraisal of future conditions is generally more optimistic or less pessimistic that the appraisals of current conditions but the direction of changes in the future conditions index are much like those in the current conditions index. Apparently, the Economy Watchers estimates of future conditions are highly influenced by their appraisal of current conditions. The correlation between the two series is .98, as shown in the attached chart. As for the component series, they, too, show high correlations between current and future appraisals. Correlations between current and future conditions for the component series are shown in the table below. The correlations are high, the lowest being .82 for the Eating and Drinking establishments.
| ECONOMY WATCHERS SURVEY | Feb 10 | Jan 10 | Feb 09 | M/M % Chg | Y/Y% Chg | 2009 | 2008 | 2007 |
|---|---|---|---|---|---|---|---|---|
| Current Conditions (Diffusion Index %) | 42.1 | 38.8 | 14.4 | 8.51 | 117.01 | 34.6 | 28.9 | 44.9 |
| Future Conditions | 44.8 | 41.9 | 26.5 | 6.92 | 69.06 | 38.3 | 31.6 | 46.9 |
| Current Conditions | Correlation | |||||||
| Total | 42.1 | 38.8 | 19.4 | 8.51 | 117.01 | .98 | ||
| Households | 40.6 | 37.4 | 21.5 | 8.56 | 88.84 | .97 | ||
| Retail Sales | 40.6 | 36.8 | 21.1 | 10.33 | 92.42 | .97 | ||
| Eating and Drinking | 36.0 | 32.7 | 17.2 | 10.09 | 109.30 | .82 | ||
| Services | 42.1 | 39.3 | 22.6 | 7.12 | 86.28 | .93 | ||
| Housing | 39.7 | 38.6 | 25.0 | 2.85 | 58.80 | .96 | ||
| Corporations | 43.8 | 40.4 | 16.7 | 8.42 | 162.28 | .96 | ||
| Manufacturing | 45.0 | 42.1 | 17.2 | 6.89 | 161.63 | .94 | ||
| Nonmanufacturing | 43.1 | 39.0 | 16.3 | 10.51 | 164.42 | .97 | ||
| Employment | 48.0 | 44.3 | 11.9 | 8.35 | 303.36 | .98 | ||

Tom Moeller
AuthorMore in Author Profile »Prior to joining Haver Analytics in 2000, Mr. Moeller worked as the Economist at Chancellor Capital Management from 1985 to 1999. There, he developed comprehensive economic forecasts and interpreted economic data for equity and fixed income portfolio managers. Also at Chancellor, Mr. Moeller worked as an equity analyst and was responsible for researching and rating companies in the economically sensitive automobile and housing industries for investment in Chancellor’s equity portfolio. Prior to joining Chancellor, Mr. Moeller was an Economist at Citibank from 1979 to 1984. He also analyzed pricing behavior in the metals industry for the Council on Wage and Price Stability in Washington, D.C. In 1999, Mr. Moeller received the award for most accurate forecast from the Forecasters' Club of New York. From 1990 to 1992 he was President of the New York Association for Business Economists. Mr. Moeller earned an M.B.A. in Finance from Fordham University, where he graduated in 1987. He holds a Bachelor of Arts in Economics from George Washington University.
More Economy in Brief


