 Global| Dec 08 2009
U.S. Consumer Credit OutstandingDrops; Earlier Declines Shaved
by:Tom Moeller
|in:Economy in Brief
Summary
The Federal Reserve reported yesterday that consumer credit outstanding fell by $3.5B m/m during October. While it was the thirteenth monthly drop since summer 2008, earlier declines were trimmed. And though consumer credit [...]
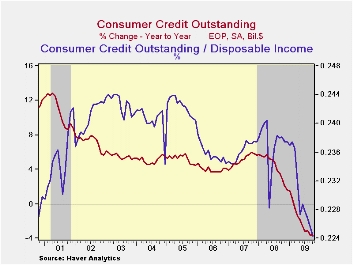 The
Federal Reserve reported yesterday that consumer credit outstanding
fell by $3.5B m/m during October. While it was the thirteenth monthly
drop since summer 2008, earlier declines were trimmed. And though
consumer credit outstanding as a percentage of disposable income has
fallen to 22.4% from its 2005 high of 24.7%, these rates are up from
the low near 16% in the early-1990s.
The
Federal Reserve reported yesterday that consumer credit outstanding
fell by $3.5B m/m during October. While it was the thirteenth monthly
drop since summer 2008, earlier declines were trimmed. And though
consumer credit outstanding as a percentage of disposable income has
fallen to 22.4% from its 2005 high of 24.7%, these rates are up from
the low near 16% in the early-1990s.
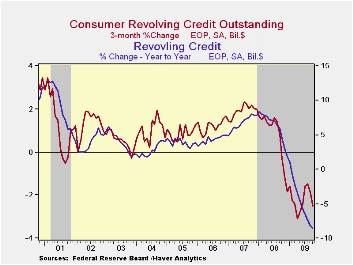 The recent
improvement
in consumer sentiment may be reducing the aversion to credit. Consumers
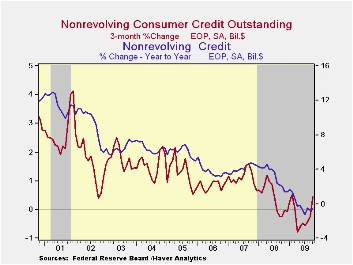
during October actually raised their level of non-revolving credit for
the third month this year. Declines earlier in 2009 were revised
sharply shallower and the recent three-month change of +0.5% compares
to this year's deepest of -0.8% during April. Usage of non-revolving
credit (autos & other consumer durables), which accounts for
nearly two-thirds of the total, fell $6.9B after an $8.7B September
decline that was deeper than reported initially, as were earlier
declines. The 8.5% y/y decline was by far a record.
The recent
improvement
in consumer sentiment may be reducing the aversion to credit. Consumers
during October actually raised their level of non-revolving credit for
the third month this year. Declines earlier in 2009 were revised
sharply shallower and the recent three-month change of +0.5% compares
to this year's deepest of -0.8% during April. Usage of non-revolving
credit (autos & other consumer durables), which accounts for
nearly two-thirds of the total, fell $6.9B after an $8.7B September
decline that was deeper than reported initially, as were earlier
declines. The 8.5% y/y decline was by far a record.
 Savings
institutions actually raised their level of lending during the last
three months (-3.5% y/y). Commercial bank loans were stable,
though still down a sharp 3.6% y/y. Loans from credit unions also
increased slightly since the spring (1.9% y/y) and the Federal
government & Sallie Mae raised their level of credit
outstanding by more than two-thirds y/y.
Savings
institutions actually raised their level of lending during the last
three months (-3.5% y/y). Commercial bank loans were stable,
though still down a sharp 3.6% y/y. Loans from credit unions also
increased slightly since the spring (1.9% y/y) and the Federal
government & Sallie Mae raised their level of credit
outstanding by more than two-thirds y/y.
These figures are the major input to the Fed's quarterly Flow of Funds accounts for the household sector.
Credit data are available in Haver's USECON database. The Flow of Funds data are in Haver's FFUNDS database.
Rescuing asset-backed securities markets from the Federal Reserve Bank of Chicago can be found here.
| Consumer Credit Outstanding (m/m Chg, SAAR) | October | September | Y/Y | 2008 | 2007 | 2006 |
|---|---|---|---|---|---|---|
| Total | $-3.5B | $-8.7B | -3.6% | 1.6% | 5.6% | 4.1% |
| Revolving | $-6.9B | $-8.0B | -8.5% | 1.9% | 7.8% | 5.0% |
| Non-revolving | $3.5B | $-0.9B | -0.6% | 1.4% | 4.4% | 3.6% |
U.S. Small Business Optimism Stutters
by Tom Moeller December 8, 2009
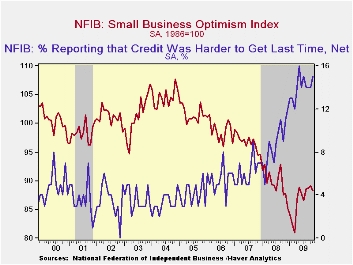 After
improving this spring, small business' optimism has leveled off. The
National Federation of Independent Business (NFIB) reported their small
business optimism index during November dipped 0.9% to 88.3 after two
months of slight increase. During the last ten years, there
has been an 85% correlation between the level of the NFIB index and the
two-quarter change in real GDP.
After
improving this spring, small business' optimism has leveled off. The
National Federation of Independent Business (NFIB) reported their small
business optimism index during November dipped 0.9% to 88.3 after two
months of slight increase. During the last ten years, there
has been an 85% correlation between the level of the NFIB index and the
two-quarter change in real GDP.
The percentage of small businesses expecting the economy to improve fell sharply to 3 from the May high of 12. The percentage which thought that now was a good time to expand the business also leveled off at 8 though it has sharply improved from this winter.
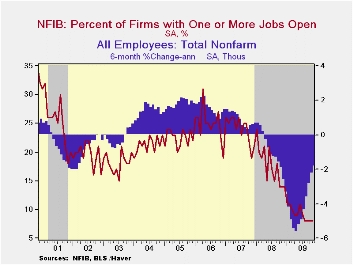 Hiring
intentions have responded negatively to the stall in
overall sentiment. The percentage of firms planning to raise employment
remained in a net-layoff region, although planned layoffs have eased
sharply from a March low. The percentage of firms with one or more job
openings held at just 8% during December, the lowest level since 1982.
During the last ten years there has been a 74% correlation between the
NFIB employment percentage and the six-month change in nonfarm
payrolls. Also stable in the negative region was the percentage
expecting credit conditions to ease.
Hiring
intentions have responded negatively to the stall in
overall sentiment. The percentage of firms planning to raise employment
remained in a net-layoff region, although planned layoffs have eased
sharply from a March low. The percentage of firms with one or more job
openings held at just 8% during December, the lowest level since 1982.
During the last ten years there has been a 74% correlation between the
NFIB employment percentage and the six-month change in nonfarm
payrolls. Also stable in the negative region was the percentage
expecting credit conditions to ease.
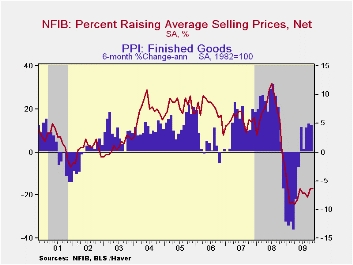 On the
pricing front, conditions
eased. The percentage of firms actually raising
prices held at a depressed -17% (indicating deflation) and
remained near the record low. During the last ten years there
has been a 60% correlation between the six-month change in the producer
price index and the level of the NFIB price index. The
percentage of firms planning to raise prices
slipped slightly to a net 4 though that remained up from the March low
of zero. Worker compensation improved modestly.
On the
pricing front, conditions
eased. The percentage of firms actually raising
prices held at a depressed -17% (indicating deflation) and
remained near the record low. During the last ten years there
has been a 60% correlation between the six-month change in the producer
price index and the level of the NFIB price index. The
percentage of firms planning to raise prices
slipped slightly to a net 4 though that remained up from the March low
of zero. Worker compensation improved modestly.
The largest, single most important problems seen by business were poor sales (33%), taxes (20%, near its highest level since 2007), government requirements (13%), insurance cost & availability (8%), competition from large businesses (6%) and inflation (3%).
About 24 million small businesses exist in the United States. Small business creates 80% of all new jobs in America and the NFIB figures can be found in Haver's SURVEYS database.
| Nat'l Federation of Independent Business | November | October | September | Y/Y | 2008 | 2007 | 2006 |
|---|---|---|---|---|---|---|---|
| Small Business Optimism Index (SA, 1986=100) | 88.3 | 89.1 | 88.8 | 0.6% | 89.8 | 96.7 | 98.9 |
| Percent of Firms Expecting Economy To Improve | 3 | 11 | 8 | -2 | -10 | -4 | -1 |
| Percent of Firms With One or More Job Openings | 8 | 8 | 8 | 14 | 18 | 24 | 25 |
| Percent of Firms Raising Avg. Selling Pric1es (Net) | -17 | -17 | -21 | 0 | 17 | 15 | 20 |
German Industrial Production Falls In October
by Louise Curley December 08, 2009
 German
Industrial Production declined almost 2% to 95.7 (2005=100) in October,
from 97.5 in September. Although expectations had been for a
small rise, yesterday's sobering report on new orders should have
dampened expectations.
German
Industrial Production declined almost 2% to 95.7 (2005=100) in October,
from 97.5 in September. Although expectations had been for a
small rise, yesterday's sobering report on new orders should have
dampened expectations.
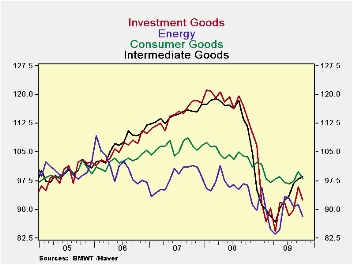
Among the Main Industrial Groups, the biggest declines were in the production of investment goods, 3.55%, and in that of energy, 3.40%. Production of consumer goods also declined but to a lesser extent, 1.90%. Production of intermediate goods was actually up, 0.61%. As reported yesterday, domestic orders for intermediate goods were up sharply. The first chart shows the indexes for the four Main Industrial Groups.
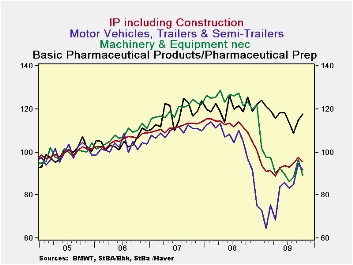 More
specific information on production is
available in the detailed breakdown of production. Production
of machinery and equipment, nec, declined 7.56% from September to
October, production of coke and refined petrol products was down 3.86%
and motor vehicle production was down 3.27%. Surprisingly,
some of the largest declines were in food, beverages and tobacco,
3.59%, and textiles, 5.04%. Production of computers and
pharmaceuticals were notable exceptions to the October
decline. Computers, electronic and optical products and
electric equipment rose 2.25% and basic pharmaceutical products and
preparations rose 2.35%. Total Industrial Production,
together with production of machinery and equipment, nec, motor
vehicles and pharmaceutical products are shown in the second
chart.
More
specific information on production is
available in the detailed breakdown of production. Production
of machinery and equipment, nec, declined 7.56% from September to
October, production of coke and refined petrol products was down 3.86%
and motor vehicle production was down 3.27%. Surprisingly,
some of the largest declines were in food, beverages and tobacco,
3.59%, and textiles, 5.04%. Production of computers and
pharmaceuticals were notable exceptions to the October
decline. Computers, electronic and optical products and
electric equipment rose 2.25% and basic pharmaceutical products and
preparations rose 2.35%. Total Industrial Production,
together with production of machinery and equipment, nec, motor
vehicles and pharmaceutical products are shown in the second
chart.
Industrial production rarely proceeds in an smooth trend. The October decline may be only a slight interruption like the July decline that was quickly reversed. A continuation of the decline in the Euro that started last Thursday would do much to stimulate German production.
| GERMANY INDUSTRIAL PRODUCTION (2005=100) | Oct 09 | Sep 09 | Oct 08 | M/M % CHG | Y/Y %CHG | 2008 | 2007 | 2006 |
|---|---|---|---|---|---|---|---|---|
| Total | 95.7 | 97.5 | 109.3 | -1.85 | -12.44 | 111.5 | 111.6 | 105.4 |
| Intermediate Goods | 98.5 | 97.9 | 111.6 | 0.61 | -11.74 | 114.0 | 114.6 | 107.1 |
| Investment Goods | 98.5 | 97.9 | 113.6 | -3.55 | -18.57 | 116.9 | 114.8 | 105.9 |
| Consumer Goods | 98.0 | 99.9 | 103.9 | -1.90 | -5.68 | 104.3 | 106.3 | 102.7 |
| Energy | 88.1 | 91.2 | 96.4 | -3.40 | -8.61 | 95.7 | 98.3 | 100.9 |
| Machinery and Equipment, nec | 89.2 | 96.5 | 123.0 | -7.56 | -27.95 | 124.6 | 119.4 | 107.4 |
| Motor Vehicles | 91.7 | 94.8 | 97.0 | -3.27 | -5.46 | 104.2 | 109.6 | 102.6 |
| Computers, electronic & optical products & elec. eq. | 104.3 | 102.0 | 124.7 | 2.25 | -16.36 | 128.4 | 124.3 | 112.8 |
| Basic Pharmaceutical products and preparations | 117.5 | 114.8 | 125.5 | 2.35 | -6.37 | 120.5 | 117.5 | 104.7 |

Tom Moeller
AuthorMore in Author Profile »Prior to joining Haver Analytics in 2000, Mr. Moeller worked as the Economist at Chancellor Capital Management from 1985 to 1999. There, he developed comprehensive economic forecasts and interpreted economic data for equity and fixed income portfolio managers. Also at Chancellor, Mr. Moeller worked as an equity analyst and was responsible for researching and rating companies in the economically sensitive automobile and housing industries for investment in Chancellor’s equity portfolio. Prior to joining Chancellor, Mr. Moeller was an Economist at Citibank from 1979 to 1984. He also analyzed pricing behavior in the metals industry for the Council on Wage and Price Stability in Washington, D.C. In 1999, Mr. Moeller received the award for most accurate forecast from the Forecasters' Club of New York. From 1990 to 1992 he was President of the New York Association for Business Economists. Mr. Moeller earned an M.B.A. in Finance from Fordham University, where he graduated in 1987. He holds a Bachelor of Arts in Economics from George Washington University.
More Economy in Brief


