 Global| Jan 09 2008
U.S. Consumer Credit Growth Up in November, Trend Down Sharply
by:Tom Moeller
|in:Economy in Brief
Summary
At an annual rate, consumer credit grew 7.7% in November. That was a recovery from the depressed 1.0% gain in October. In a sign of weaker consumer spending, year to year the 5.2% growth in credit is down slightly from its recent peak [...]
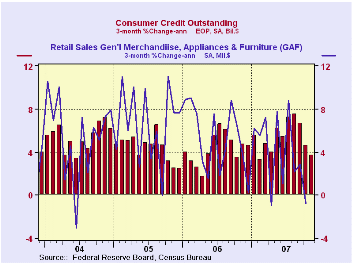
At an annual rate, consumer credit grew 7.7% in November. That was a recovery from the depressed 1.0% gain in October.
In a sign of weaker consumer spending, year to year the 5.2% growth in credit is down slightly from its recent peak of 5.4%. The three month change however is down sharply to 3.7%, half the growth rate of this past August.
The accompanying chart indicates just how sharply the growth
in consumer spending has slowed. Sales of general merchandise,
appliances and furniture (major items that are financed) declined
slightly in the three months ended in October.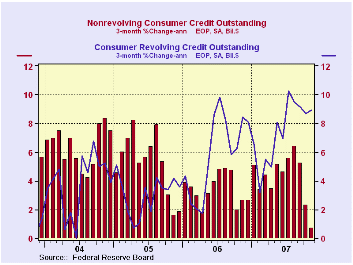
Non-revolving credit, which accounts for nearly two thirds of the total, grew a somewhat slower 3.9% in November versus October, but the three month growth rate collapsed to 0.7% from its peak of 6.4% in August.
Revolving credit grew a faster 12.0% in November versus October, but here again the 9.0% three month growth rate is down from the 10.2% rate of growth this past July.
These figures are the major input to the Fed's Flow of Funds accounts for the household sector, released quarterly. For the third quarter, an acceleration in consumer credit growth (as evidenced by the three month peaks noted above) was accompanied by a sharp acceleration in bank loans.
Dollars and Sense is a recent speech by William Poole, President of the Federal Reserve Bank of St. Louis and it is available here.
| Consumer Credit (m/m Chg, SAAR) | November | October | Y/Y | 2006 | 2005 | 2004 |
|---|---|---|---|---|---|---|
| Total | 7.7% | 1.0% | 5.2% | 4.5% | 4.3% | 5.5% |
| Revolving | 12.0 | 8.9 | 7.4 | 6.1 | 3.1 | 3.8 |
| Non-revolving | 3.9 | 4.1 | 3.9 | 3.6 | 4.9 | 6.4 |
by Robert Brusca January 9, 2008
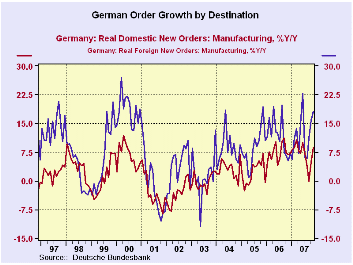
German real new orders are flying high again in November after
another surprising spurt in October. After the October rise, a drop off
in November orders had been expected - quite the opposite is the
result. Orders are now growing at an annualized rate of 28% in the
fourth quarter over Q3; domestic orders are up at a 16% pace. As in
October bulk orders are responsible for the spurt in November. And a
relatively new metric tells us that German new orders from outside the
Euro Area fell last month. So, despite the spurt, it may be that the
strong euro is taking some toll after all. German foreign orders use
the definition of ‘foreign to Germany’ not to its currency area. That
is one complication when looking at ‘foreign’ data of any sort for Euro
Area members. Even so, the strength within the Area that German orders
imply is quite remarkable, and it is in stark contrast with other
measures that show a backtracking in confidence and in activity of
various sorts in Germany and throughout the Euro Area.
| German Orders and Sales By Sector and Origin | ||||||||
|---|---|---|---|---|---|---|---|---|
| Real and SA | % M/M | % Saar | ||||||
| Nov-07 | Oct-07 | Sep-07 | 3-Mo | 6-Mo | 12-Mo | Year Ago | ||
| Total Orders | 3.4% | 4.0% | -1.6% | 25.4% | 12.0% | 13.6% | 6.0% | |
| Foreign | 2.8% | 5.3% | -0.8% | 32.8% | 15.2% | 18.2% | 5.2% | |
| Domestic | 4.2% | 2.5% | -2.4% | 18.1% | 8.7% | 8.8% | 6.9% | |
| Sector Sales | ||||||||
| Manufacturing/Mining | -0.6% | 1.3% | -0.3% | 1.6% | 0.8% | 4.4% | 8.0% | |
| Consumer Goods | -0.7% | 0.8% | -0.3% | -0.8% | -0.4% | 1.1% | 3.8% | |
| Consumer Durables | -0.6% | -1.3% | -4.0% | -21.5% | -11.4% | -1.5% | 8.2% | |
| Consumer Nondurable | -0.7% | 1.1% | 0.5% | 3.8% | 1.9% | 1.5% | 3.0% | |
| Capital Goods | -2.1% | 3.3% | -0.2% | 3.4% | 1.7% | 5.5% | 8.6% | |
| Intermediate Goods | 1.5% | -0.6% | -0.2% | 2.3% | 1.1% | 5.1% | 10.1% | |
| All Manufacturing Sales | -0.7% | 1.2% | -0.2% | 1.3% | 0.7% | 3.9% | 7.5% | |
by Robert Brusca January 9, 2008
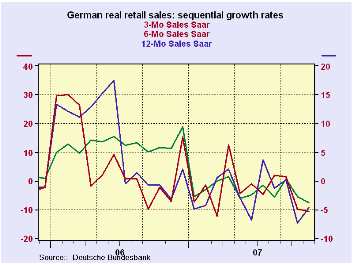
So much for strong German orders…. there is no carry over to
the consumer. Retail sales in Germany are a disaster. We are 10 months
away from the phase in of the VAT hike in January of 2007. That is why
the Yr/Yr decline is still so severe on the chart – the base is a pre
VAT base in Nov of 2006. It is not really not comparable to the 3-Mo
and the 6-Mo results which are both with base periods that are well
beyond the VAT hike period. Still 3-Mo and 6-Mo real retail sales
growth rates are weaker that their 12-month pace. This is not a good
sign.
Two months into Q4 German real retail sales (ex autos) are
declining at an 8.2% annual rate. Nominal clothing and footwear
spending is off in the quarter at a 23% rate. November sales were a
disaster.
| German Real and Nominal Retail Sales | New Qtr | |||||||
|---|---|---|---|---|---|---|---|---|
| Nominal | Nov-07 | Oct-07 | Sep-07 | 3-Mo | 6-Mo | 12-Mo | Year Ago | SAAR |
| Retail excl Auto | -0.6% | -1.9% | 1.1% | -5.7% | -1.5% | -1.7% | 6.1% | -8.2% |
| Motor Vehicle and Parts | #N/A | 0.2% | -2.0% | #N/A | #N/A | #N/A | 21.0% | #N/A |
| Food Beverages & Tobacco | -2.3% | 0.1% | 1.4% | -3.2% | -2.0% | 0.2% | 3.2% | -1.4% |
| Clothing footwear | -0.8% | -8.3% | 5.6% | -15.1% | 1.1% | -1.2% | 5.7% | -23.0% |
| Real | ||||||||
| Retail excl Auto | -1.3% | -2.3% | 0.8% | -10.7% | -4.6% | -3.8% | 5.6% | -12.6% |
by Robert Brusca January 9, 2008
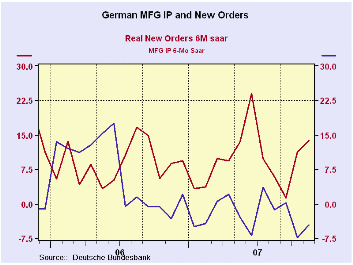
MFG output fell in November after a rise of 0.1% in October
and a flat September. Amid other circumstances this might seem a very
chilling set of numbers. With this weakness the Q4 path for IP two
months into the quarter is a pace of just 1.2% at an annual rate. It is
only the sharp and mind blowing gains in orders that keep the erosion
in Manufacturing output from seeming like more of a problem. Certainly,
of the two measures, output is more important. But orders are a promise
of output to come. Unfortunately there have been sizeable disconnects
between orders and output before. Since mid-2006 the growth of orders
has exceed the growth of output in Germany and by a wide margin. The
current disconnect is even larger than what it generally has been over
the past 18 months.
| Total German IP | |||||||
|---|---|---|---|---|---|---|---|
| Saar except m/m | Nov-07 | Oct-07 | Sep-07 | 3-Mo | 6-Mo | 12-Mo | Quarter to-Date |
| IP total | -0.9% | 0.1% | 0.0% | -3.3% | 2.3% | 3.5% | 1.2% |
| Consumer goods | -2.3% | -0.9% | 0.2% | -11.6% | -5.5% | 0.3% | -3.2% |
| Capital goods | -0.8% | 2.0% | -0.5% | 2.8% | 7.0% | 6.3% | 8.9% |
| Intermediate goods | -0.4% | -0.9% | 0.2% | -4.4% | 2.6% | 4.6% | -2.1% |
| Memo | |||||||
| Construction | -0.7% | -1.5% | 0.2% | -7.6% | -3.4% | -7.0% | -5.4% |
| MFG IP | -0.9% | 0.2% | -0.1% | -2.9% | 2.7% | 4.5% | 2.0% |
| MFG Orders | 3.4% | 4.0% | -1.6% | 25.4% | 13.7% | 13.6% | 27.9% |

Tom Moeller
AuthorMore in Author Profile »Prior to joining Haver Analytics in 2000, Mr. Moeller worked as the Economist at Chancellor Capital Management from 1985 to 1999. There, he developed comprehensive economic forecasts and interpreted economic data for equity and fixed income portfolio managers. Also at Chancellor, Mr. Moeller worked as an equity analyst and was responsible for researching and rating companies in the economically sensitive automobile and housing industries for investment in Chancellor’s equity portfolio. Prior to joining Chancellor, Mr. Moeller was an Economist at Citibank from 1979 to 1984. He also analyzed pricing behavior in the metals industry for the Council on Wage and Price Stability in Washington, D.C. In 1999, Mr. Moeller received the award for most accurate forecast from the Forecasters' Club of New York. From 1990 to 1992 he was President of the New York Association for Business Economists. Mr. Moeller earned an M.B.A. in Finance from Fordham University, where he graduated in 1987. He holds a Bachelor of Arts in Economics from George Washington University.
More Economy in Brief


