 Global| Jun 08 2010
U.S. Consumer Credit Expands Modestly In April
by:Tom Moeller
|in:Economy in Brief
Summary
The latest consumer credit numbers released late-yesterday indicated that credit rose $1.0B during April. However, the Federal Reserve revised the March figure to a sharp $5.4B decline from a $2.0B increase reported last month. While [...]
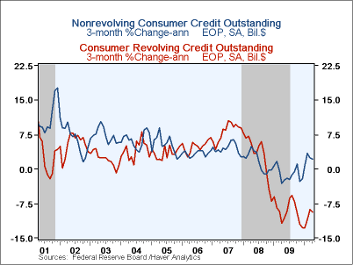
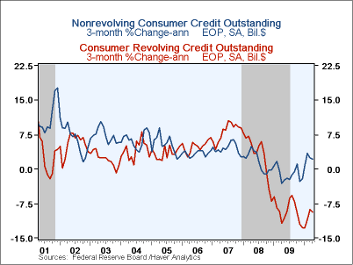
The latest consumer credit numbers released late-yesterday indicated that credit rose $1.0B during April. However, the Federal Reserve revised the March figure to a sharp $5.4B decline from a $2.0B increase reported last month. While these m/m figures should initially be interpreted with caution, the trend in credit usage seems to be turning away from the sharp reductions of last year. The y/y change has moderated to -3.2% from -4.4% at its worst last December and the three-month change is -2.0% (AR).
he most that can be said about the pullback in the usage of revolving credit is that it perhaps is stabilizing. An $8.5B April decline followed a revised $3.7B drop and the three-month change of $-9.4% was reduced from the worst of $-12.9B in January. Pools of securitized assets were virtually unchanged (-88.7% y/y) after a sharp March decline. Finance companies also held lending constant (+28.9% y/y) though commercial bank lending slipped (+79.7% y/y). Loans from credit unions also were constant (+5.5% y/y) while lending by savings institutions slipped (+15.1%).
Usage of non-revolving credit (autos & other consumer durables), which accounts for nearly two-thirds of the total seems firmer. It fell modestly during the recession but has increased this year. Usage rose $9.5B in April after falling $1.7B, but that March decline initially was reported as a $5.2B increase. Federal government & Sallie Mae lending expanded by three-quarters y/y while commercial bank lending rose 6.8% after last year's 1.0% increase. These gains offset a nearly one-half y/y decline in pools of securitized assets, a 16.6% fall in savings institutions, an easier 3.3% decline in finance companies and a 3.2% fall in credit union lending.
During the last ten years, there has been a 60% correlation between the y/y change in credit outstanding and the change in personal consumption expenditures. Moreover, these figures are the major input to the Fed's quarterly Flow of Funds accounts for the household sector.
Credit data are available in Haver's USECON database. The Flow of Funds data are in Haver's FFUNDS database.
Moving Beyond the Financial Crisis is today's speech by Fed Governor Elizabeth A. Duke and it can be found here here.
| Consumer Credit Outstanding (m/m Chg, SAAR) | April | March | February | y/y | 2009 | 2008 | 2007 |
|---|---|---|---|---|---|---|---|
| Total | $1.0B | $-5.4B | $-7.8B | -3.2% | -4.4% | 1.5% | 5.7% |
| Revolving | $-8.5B | $-3.7B | $-8.7B | -9.6% | -9.6% | 1.6% | 8.1% |
| Non-revolving | $9.5B | $-1.7B | $0.9B | 0.5% | -1.3% | 1.5% | 4.4% |
by Tom Moeller June 8, 2010
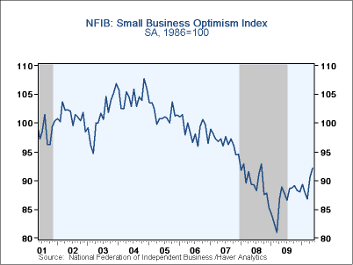 Small businesses are joining in with the broader improvement in the economy. The National
Federation of Independent Business (NFIB) reported their May small
business optimism index rose m/m to 92.2. It remained the highest level
since September 2008. During the last ten years there has been an 85%
correlation between the level of the NFIB index and the two-quarter
change in real GDP.
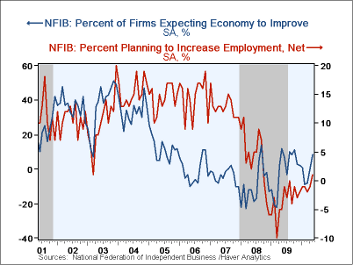
The lift came as an increased percentage of firms expected the economy to improve with higher sales and (much) higher earnings. Firms also expected to add to inventories for the first time since late-2007.
Hiring plans have improved. The percentage of firms with one or more job openings slipped m/m but the percentage planning to lift employment was positive for the first time since September 2008. During the last ten years there has been a 74% correlation between the NFIB employment index and the six-month change in nonfarm payrolls.
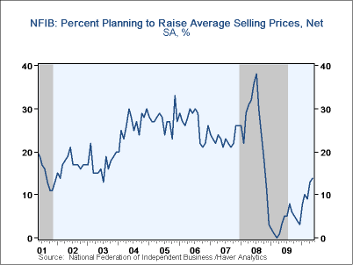
Pricing activity improved. The percentage of firms planning to raise prices rose to its highest level since late-2008. The percentage of firms actually raising prices slipped to -15% (indicating deflation). Finally, the percentage planning to raise worker compensation slipped m/m to 4% though that was improved from none in March 2009. During the last ten years there has been a 51% correlation between the six-month change in the producer price index and the level of the NFIB price index.
The most important problems seen by business were poor sales (30%), taxes (22%), government requirements (13%), insurance cost & availability (9%), competition from large businesses (6%) and inflation (4%).
About 24 million small businesses exist in the United States. Small business creates 80% of all new jobs in America and the NFIB figures can be found in Haver's SURVEYS database.
| Nat'l Federation of Independent Business | May | April | March | May '09 | 2009 | 2008 | 2007 |
|---|---|---|---|---|---|---|---|
| Small Business Optimism Index (SA, 1986=100) | 92.2 | 90.6 | 86.8 | 88.9 | 86.7 | 89.8 | 96.7 |
| Percent of Firms Expecting Economy To Improve | 8 | 0 | -8 | 12 | -0 | -10 | -4 |
| Percent of Firms With One or More Job Openings | 9 | 11 | 9 | 9 | 9 | 18 | 24 |
| Percent of Firms Reporting That Credit Was Harder To Get | 13 | 14 | 15 | 16 | 14 | 9 | 6 |
| Percent of Firms Raising Avg. Selling Prices (Net) | -15 | -11 | -20 | -22 | -20 | 17 | 15 |
by Tom Moeller June 8, 2010
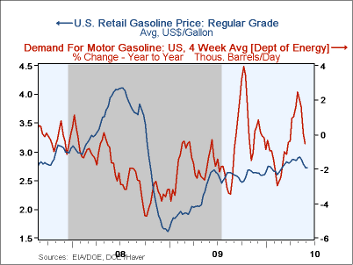 U.S. gasoline prices are down from their recent
high, but the decline seems to be loosing momentum. The pump price of regular
gasoline held steady last week at $2.73 per gallon prices
and prices remained up more than three-quarters since the December 2008
low. Yesterday the spot market price for a gallon of regular gasoline
also held roughly steady with last week's average of $1.94 which was up
from the prior two weeks' average. The figures are reported by the U.S.
Department of Energy and can be found in Haver's WEEKLY
& DAILY databases.
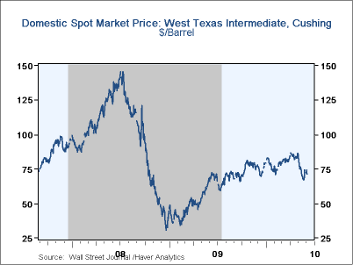
The average price for a barrel of light sweet crude (WTI) rose last week to $72.89 but remained down from the high of $84.23 averaged during April. Yesterday, crude prices slipped with Friday's weak U.S. employment report but at $71.44 per barrel were up from the May 24th low of $66.88.
Demand for gasoline seems to be slipping with higher prices. It fell 0.5% last week versus one year ago but that compares to a 3.0% decline in early-February. The demand for residual fuel oil jumped 32.0%% and distillate demand also surged 11.7% y/y. That's improved from a 12.3% decline during February. Inventories of crude oil and petroleum products slipped in late-May but still were up sharply from the early 2010 low.
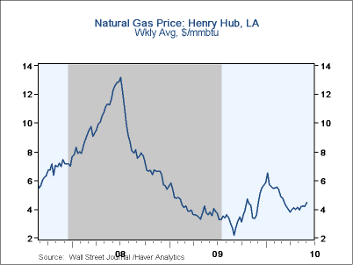
U.S. natural gas prices strengthened further last week to an average $4.46 per mmbtu (17.5% y/y). Nevertheless, prices remained down from a high of $6.50 early in January.
The energy price data can be found in Haver's WEEKLY database while the daily figures are in DAILY. The gasoline demand figures are in OILWKLY.
| Weekly Prices | 06/07/10 | 05/31/10 | 05/24/10 | y/y | 2009 | 2008 | 2007 |
|---|---|---|---|---|---|---|---|
| Retail Regular Gasoline ($ per Gallon, Regular) | 2.73 | 2.73 | 2.79 | 3.8% | 2.35 | 3.25 | 2.80 |
| Light Sweet Crude Oil, WTI ($ per bbl.) | 72.89 | 71.13 | 69.02 | 7.0% | 61.39 | 100.16 | 72.25 |
| Natural Gas Price ($/mmbtu) | 4.46 | 4.18 | 4.25 | 17.5% | 3.95 | 8.88 | 6.97 |
by Tom Moeller June 8, 2010
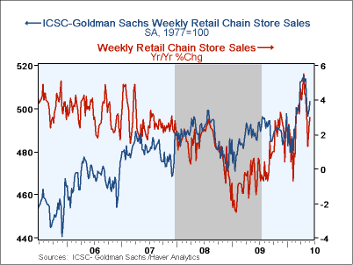
Consumers continued to hold their breath after their late-April shopping spree. Chain store sales last week rose just modestly but roughly equaled the May average. In turn, they were down from the April high. However, versus late-February sales broke from the earlier malaise and rose 3.6%.
During the last ten years there has been a 68% correlation between the y/y change in chain store sales and the change in retail sales at general merchandise stores. That correlation recently has increased.
The ICSC-Goldman Sachs retail chain-store sales index is constructed using the same-store sales (stores open for one year) reported by 78 stores of seven retailers: Dayton Hudson, Federated, Kmart, May, J.C. Penney, Sears and Wal-Mart. During the last ten years there has been a 69% correlation between the year-to-year growth in chain store sales and the growth in general merchandise retail sales. The weekly figures are available in Haver's SURVEYW database.
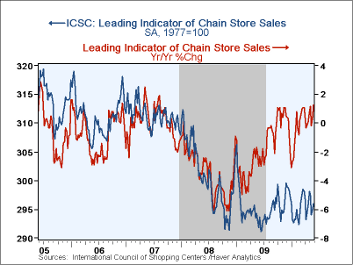
The leading indicator of chain store sales continued to move sideways. During all of May it equaled April but was at the high end of the range in place since the middle of last year. Nevertheless, stability in the index compares to roughly 6% y/y declines late in 2008. The composite leading economic indicator is compiled from four series: (1) the MBA's volume index of mortgage applications for home purchase (2) the ABC News/Money magazine's survey of consumer buying conditions (3) new filings for jobless benefits and (4) the 30-year government bond yield.
The Dire Straights Of Europe And Other Fairy Tales Or, The Walk Of Death?
by Robert Brusca June 8, 2010
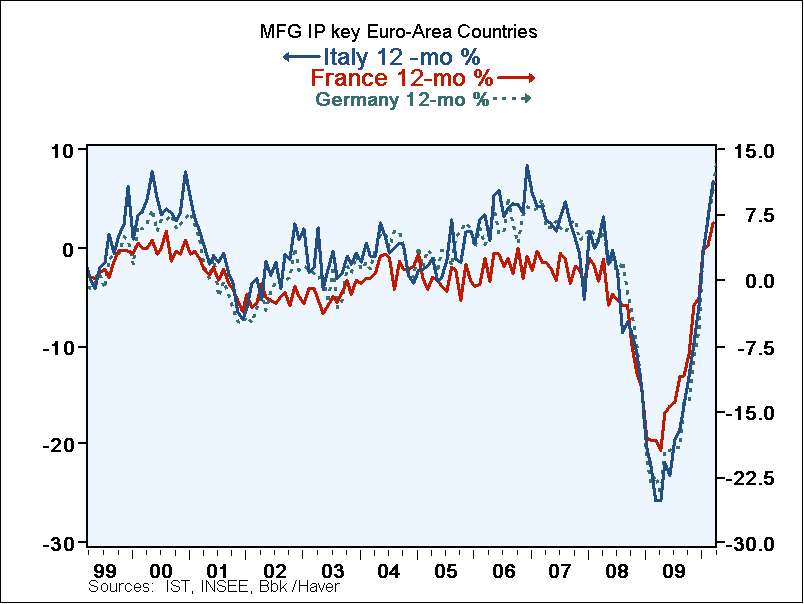
IP over board! That's right IP is brimming over with growth. German IP is up sharply in April and it is a race with the IP from Italy- of all places. So this raises a question: how many European optimists can you fit in one of those picturesque, red British Telecom phone booths? Answer- all of them! ...that is if you can find any at all.
Phone booths? Who care about a phone booth except Clark Kent? I know what you are thinking, in an age of cell phones (or mobiles if you are a Brit) who gives a ding-dong about phone booths? But there you go again changing the subject. No one wants to talk about optimism. Everything right now is about pessimism and that is the point. So lets dot he unthinkable and talk about the empty phone booth.
The end of pessimism is not like waiting for the end of days- There is in fact no better time to talk about optimism but when things are so dark and bleak. It's sort of like horror film. You don't need to have seen 'it' to 'know' what's going to happen, you just need to know how long the movie is going to be and to pick you spot... No matter how grisly and unwatchable the movie, in the last 10-15 minutes, the worm will turn and someone will somehow vanquish the killer vampire, the bug from outer space or the depraved sadist psycho-killer or whatever. The difference is that in markets we don't know exactly when it will end. Bear markets don't come with a time-stamp. We do know that the bear market will end, for stocks, for the euro, and so on. Everything ends (well maybe not the oil leak in the Gulf of Mexico- note that the NY Times, the custodian of language, calls it a 'leak', not a gusher).
Description as reality - So that raises another point, and that is that things often become what they are described to be, making the metamorphosis from what they really are.
Man bites dog is no story; stocks fall forever is a GREAT story - And, to come full circle, that is sort of why everyone is so pessimistic. Everyone has a thousand reasons why things are so bad. It's good to remember that there is a circle of securities trading that revolves around the evolution of economic data and news. And even the most basic trader knows that news makes money and if you can get out in front of the news, that's the safest place to be. Any way that a trader can manipulate the news can help him (or her) to make money. So there is no lack of traders trying to feed the beast with stories of how bad it is or how bad it is going to be, in order to extend the trend and keep the trading environment 'safe;' safe for traders at least. We have visited this subject before.
Phases of the market and the moon and the milky way - Markets have up-phases and down-phases and right now we are in a down-phase, for stocks and the euro and up-phase for gold; oil is not quite sure what it is doing it is just plain 'phased out'. I will remind you that there are accumulation and distribution phases to market trading and if ever there was a distribution phase this is one. Stocks have been sold to extremes the euro has been sold to an extreme and the all the easy money has been made. Whatever moves are left to these current trends they will reap profits for those who already have the positions passing the riskier trades onto the Johnny-come-lately investor. Don't let that be you. So Johnny don't come late, just go quietly. There is no sense in getting short by trying to make money over already-been-spilled-milk.
Reality bites ...back - Economic forecasts for Switzerland today were just lifted. German data are looking good. Yes Spain can be added to the list of countries undertaking austerity with public sector blow-back. But what profession takes pay cuts sitting down? Not firemen! Not policeman! Not teachers! Not Wall Street! OK point made. Blowback is part of the process, it's NOT NEWS!
Fairy tales can come true, but what if they do? - Meanwhile the underlying disturbing development everyone is watching with baited-breath is Germany's early move to adopt some austerity. How risky is this after all? On the face of it this seems a little bit like a fairy tale in which the king that likes the goose's golden eggs so much he wonders what its flesh tastes like. Germany should not go there and disrupt the golden egg of growth by messing with fiscal policy. But even if it does, it's far from clear to me that it would do enough damage to seriously disrupt the recovery that is in process. That's right Germany's flirtation with austerity is another red-herring for weak growth.
Achtung baby... NEWS FLASH!! German growth does not depend on German demand! In Germany, the recovery is substantially about exploiting FOREIGN DEMAND. Yr/Yr capital goods output is up by 14% intermediate goods output is up by 21%. The output of consumer goods is up by 1%- yes that also is Year over year. How much more damage to that +1% Yr/Yr growth can Germany do? Oh, and over three months German consumer goods consumption is falling at 5.8% annual rate while overall IP is rising at a 21% annual rate. So do we even care about the German consumer? Achtung baby, but none for the German consumer.
What Germany wants, what Germany needs - The issue in Germany is that it 'is needed' to promote domestic consumption but that it 'needs' to do this for the rest of the world not for itself. But Germany 'wants' to attain more fiscal discipline so it will throw the consumer under the bus and that will not affect German export growth. But it could make for a good horror movie called "Schnell II' starring Keanu Reeves and Sandra Bullock as unwilling runaway bus drivers. Whether domestic private consumption lags or contracts in Germany does not seem to matter much; the consumer seems destined to be a footnote in Germany's expansion which for Germany will press ahead on export-led growth fueled by a weak euro. This fiscal tact, of course, is a very selfish act by Angela Merkel who has problems of her own. As for any politician, self preservation is job-one. But let's also remember that killing off growth never did any politician any good (you can think about eating the goose and talk about it, but actually eating it is something else). What Merkel needs is the appearance of fiscal consolidation much more than severe fiscal consolidation. .So keep that thought active, as the pessimists swirl overhead sucking the very life out of optimism like the death eaters circling and closing in over the inert body of Harry Potter. Not to spoil the movie, but Harry did escape.
Not as bad as it seems - Put Europe in perspective. Growth is actually much better than people give it credit for. The downside risks are not a big as they seem when you factor in the politics of the situation (politicians need to seem to be people of action more than they need to be people of action except in a real crisis -which this is not). And pessimism has the bit in its teeth and is running wild, completely out of control. If Diogenes were alive today he could go hunting for an honest-optimist in Europe, but he clearly would run out of oil for his lamp before he would find one. Few in the financial markets ever give you an honest opinion and fewer still are optimists. Diogenes would be looking for a needle in a field of haystacks. In the markets everyone has a trading position and that gets in the way of a good honest opinion every single time. So the best approach always is to think for yourself. Read the papers and be skeptical. Ask yourself, "does what is going on the market make any sense?" That is always a good place to start. Joining a rally or sell off you don't really understand is one of the most dangerous things you can do.
| Total German IP | |||||||
|---|---|---|---|---|---|---|---|
| Saar exept m/m | Apr-10 | Mar-10 | Feb-10 | 3-mo | 6-mo | 12-mo | Quarter-to-Date |
| IP total | 0.9% | 4.3% | -0.2% | 21.6% | 10.0% | 13.2% | 24.2% |
| Consumer | -1.2% | 2.0% | -2.3% | -5.8% | 2.5% | 1.0% | -3.8% |
| Capital | -1.0% | 5.3% | 1.2% | 23.8% | 9.6% | 14.1% | 18.1% |
| Intermed | 2.8% | 3.8% | -0.1% | 29.1% | 14.6% | 21.1% | 36.7% |
| Memo | |||||||
| Construction | 2.6% | 24.4% | 0.0% | 166.0% | 16.6% | 5.1% | 171.3% |
| MFG IP | 0.6% | 3.9% | 0.0% | 19.2% | 9.9% | 14.1% | 20.5% |
| MFG Orders | 2.8% | 5.1% | 0.0 | 36.7% | 32.2% | 29.8% | 44.3% |
by Louise Curley June 8, 2010
 Japan's seasonally adjusted
current account
balance, reported today, declined 393.5 billion yen from 1,773.1
billion yen in March to 1,379.6 billion yen in April. There has however
been strong uptrend in the balance since the low point of 527.9 billion
yen reached in January 2009. The unseasonally adjusted data
show an 88% increase from 660.6 billion yen in April, 2009 to 1,242.1
billion yen, in April 2010.
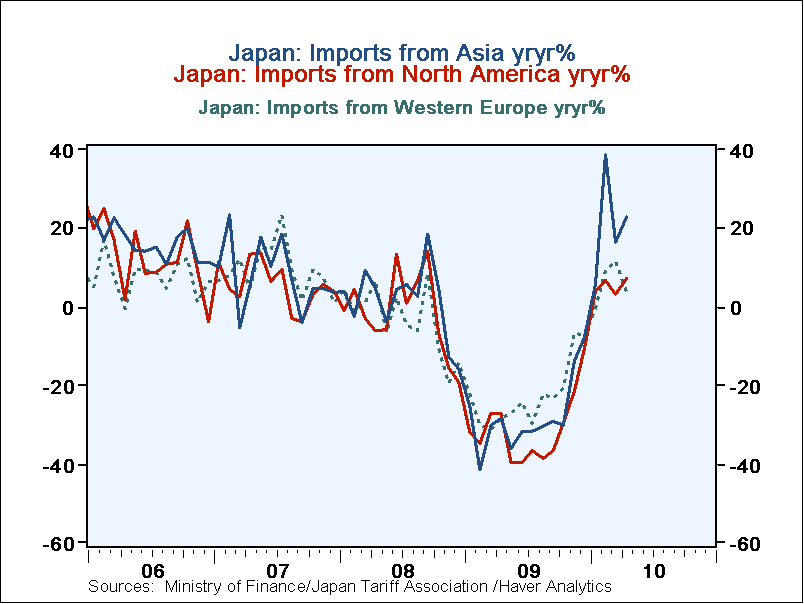
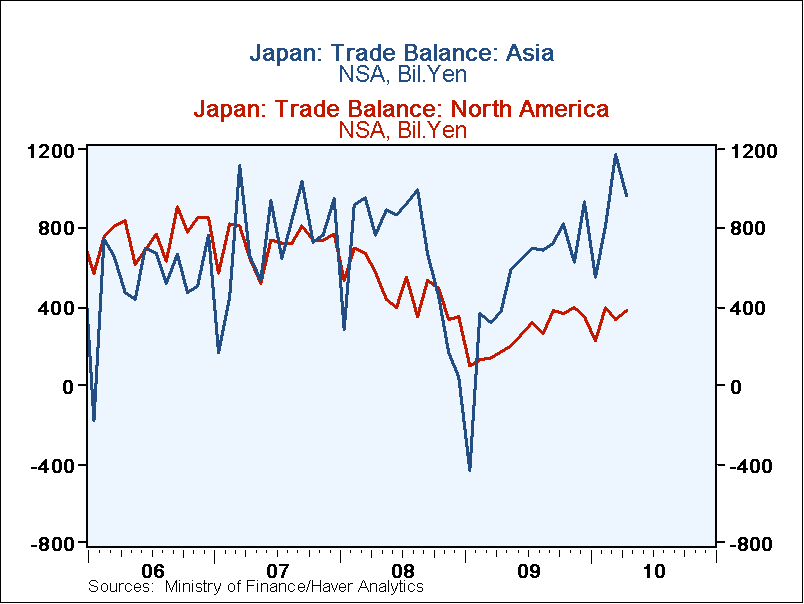
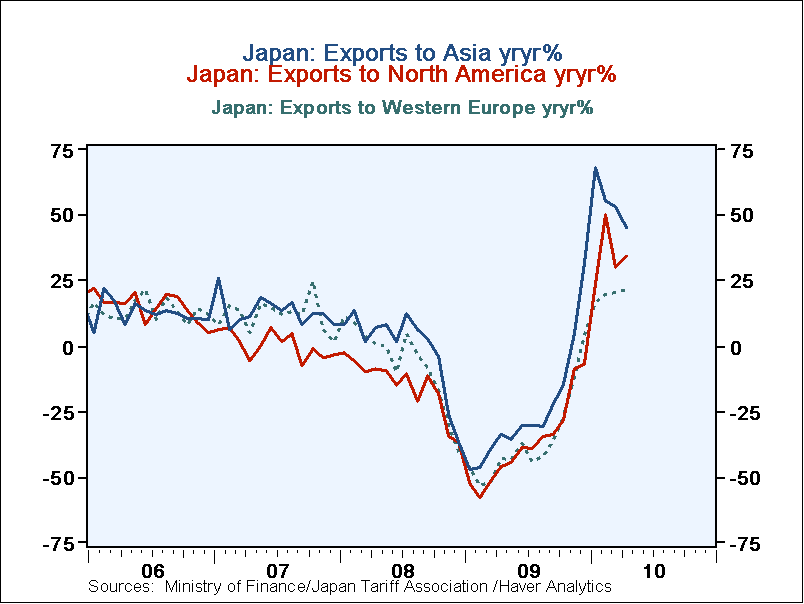
Much of the improvement in the recovery of the current account balance is due to an increase in the trade balance. Japanese exports increased 40.4% from April, 2009 to April, 2010 while imports increased 24.6%. The first two charts show the year to year percent increases in exports to North America, mainly the U. S., Western Europe and Asia, mainly China, and in imports from those same three broad areas. Over the past five years, Japanese exports to, and imports from imports from, Asia have generally risen faster than those to North America and Western Europe. Until late 2008 and early 2009, Japanese exports to Asia fluctuated between 45 and 51% of total exports. In mid 2009, exports to Asia began to accelerate and in March and April of this year, they accounted for more than 56% of total exports. There was no corresponding jump in the percent of imports from Asia. The resulting rise in Japan's balance on trade in goods with Asia has been accompanied by a decline in Japan's trade surplus with North America as can be seen in the third chart.
| JAPAN | Apr 10 | Mar 10 | Apr 09 | Y/Y % | Y/Y Bil Yen Chg |
2009 | 2008 | 2007 |
|---|---|---|---|---|---|---|---|---|
| Current Account Balance (SA) (Billion Yen) | 1379.6 | 1773.1 | 848.8 | 62.5 | 530.8 | 13289 | 16549 | 24688 |
| Current Account Balance (NSA) (Billion Yen) | 1242.1 | 2534.2 | 660.6 | 88.1 | 581.5 | 13287 | 16380 | 24794 |
| Exports (Billion Yen) | 5887.9 | 6003.6 | 4194.9 | 40.4 | 1693.2 | 54171 | 81018 | 83931 |
| North America | 951.9 | 940.3 | 708.6 | 34.3 | 243.3 | 9456 | 15331 | 18135 |
| Western Europe | 702.8 | 683.6 | 576.8 | 21.8 | 126.0 | 7077 | 11445 | 12329 |
| Asia | 3323.5 | 3380.4 | 2287.9 | 45.2 | 1036.6 | 29333 | 39966 | 40401 |
| Imports (Billion Yen) | 5147.4 | 5053.7 | 4145.7 | 24.6 | 1001.6 | 51499 | 78955 | 73136 |
| North America | 573.4 | 606.0 | 534.8 | 7.21 | 38.6 | 6378 | 9371 | 9530 |
| Western Europe | 493.3 | 590.0 | 475.5 | 3.75 | 17.8 | 6137 | 7999 | 8299 |
| Asia | 2353.9 | 2203.6 | 1915.5 | 22.9 | 43.8 | 22989 | 32034 | 31564 |
Tom Moeller
AuthorMore in Author Profile »Prior to joining Haver Analytics in 2000, Mr. Moeller worked as the Economist at Chancellor Capital Management from 1985 to 1999. There, he developed comprehensive economic forecasts and interpreted economic data for equity and fixed income portfolio managers. Also at Chancellor, Mr. Moeller worked as an equity analyst and was responsible for researching and rating companies in the economically sensitive automobile and housing industries for investment in Chancellor’s equity portfolio. Prior to joining Chancellor, Mr. Moeller was an Economist at Citibank from 1979 to 1984. He also analyzed pricing behavior in the metals industry for the Council on Wage and Price Stability in Washington, D.C. In 1999, Mr. Moeller received the award for most accurate forecast from the Forecasters' Club of New York. From 1990 to 1992 he was President of the New York Association for Business Economists. Mr. Moeller earned an M.B.A. in Finance from Fordham University, where he graduated in 1987. He holds a Bachelor of Arts in Economics from George Washington University.


