 Global| Sep 01 2009
U.S. Construction Spending Holds Steady
by:Tom Moeller
|in:Economy in Brief
Summary
Despite improvement in the residential sector, the total value of construction outlays has continued to trend lower. The overall value of construction spending ticked lower last month by 0.2% to the lowest level since February of [...]
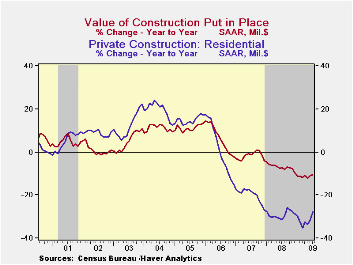
Despite improvement in the residential sector, the total value of construction outlays has continued to trend lower. The overall value of construction spending ticked lower last month by 0.2% to the lowest level since February of 2004.
The declining level of construction has very-much reflected the weakening of corporate profitability which lowered spending in the private nonresidential sector by 1.2% during July and 8.3% from one year ago. That compares to the gain for all of last year of 13.2%. The commercial sector led that weakness with a 34.6% y/y decline followed closely by a 31.3% drop in the multi-retail sector. Office building construction wasn't far behind with a 26.0% drop in activity. Easier, but still significant, shortfalls versus last year were logged by the health care (-3.6%) and educational (-10.2% y/y) sectors. Spending in the transportation sector was off just 0.6% y/y.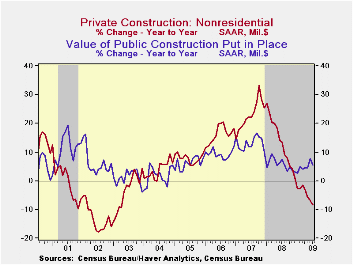
Residential building activity may be finding its bottom to the recent recession in building activity. It rose 2.3% from June. Nevertheless, spending was down by more than one-quarter from the year-ago level paced by a near-halving of single family-home activity and a 36.6% drop in multi-family spending.Sometimes it's cheaper to fix the old place up than to buy new. Spending on alterations and improvements rose 6.0% from the year-ago level.
Public construction activity has elevated the overall construction market of late. Though in July it edged down 0.5%, there's been an increase of 5.5% since last year. By sector, health care has led the y/y rise with a 29.2% jump followed by a 17.9% rise in commercial construction. Spending on highways and streets did fall slightly in July but it's up 3.4% y/y while spending on schools construction rose 4.5 y/y.
The construction put-in-place figures are available in Haver's USECON database.
| Construction (%) | July | June | Y/Y | 2008 | 2007 | 2006 |
|---|---|---|---|---|---|---|
| Total | -0.2 | 0.1 | -10.5 | -6.9 | -1.6 | 6.3 |
| Private | 0.1 | -1.6 | -17.0 | -11.1 | -5.7 | 5.5 |
| Residential | 2.3 | -0.5 | -27.8 | -29.1 | -19.7 | 1.0 |
| Nonresidential | -1.2 | -2.2 | -8.3 | 13.2 | 23.1 | 16.2 |
| Public | -0.7 | 3.6 | 5.5 | 5.6 | 13.1 | 9.3 |

Tom Moeller
AuthorMore in Author Profile »Prior to joining Haver Analytics in 2000, Mr. Moeller worked as the Economist at Chancellor Capital Management from 1985 to 1999. There, he developed comprehensive economic forecasts and interpreted economic data for equity and fixed income portfolio managers. Also at Chancellor, Mr. Moeller worked as an equity analyst and was responsible for researching and rating companies in the economically sensitive automobile and housing industries for investment in Chancellor’s equity portfolio. Prior to joining Chancellor, Mr. Moeller was an Economist at Citibank from 1979 to 1984. He also analyzed pricing behavior in the metals industry for the Council on Wage and Price Stability in Washington, D.C. In 1999, Mr. Moeller received the award for most accurate forecast from the Forecasters' Club of New York. From 1990 to 1992 he was President of the New York Association for Business Economists. Mr. Moeller earned an M.B.A. in Finance from Fordham University, where he graduated in 1987. He holds a Bachelor of Arts in Economics from George Washington University.
More Economy in Brief


