 Global| Sep 02 2008
U.S. Construction Spending Fell in July
by:Tom Moeller
|in:Economy in Brief
Summary
The value of construction put in place fell 0.6% during July and that reversed the 0.3% increases during the prior two months. The decline was as-expected. Year-to-year, construction was down 4.8% but the level of activity so far this [...]
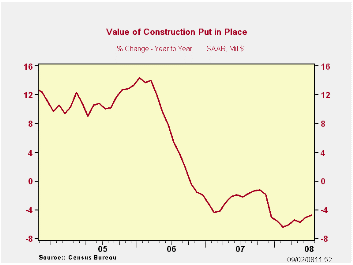
The value of construction put in place fell 0.6% during July and that reversed the 0.3% increases during the prior two months. The decline was as-expected.
Year-to-year, construction was down 4.8% but the level of activity so far this year continued roughly stable.
As in prior months, however, residential building activity continued to decline sharply, by 2.1% in July. Since it's peak it has fallen by just over one half. Single-family construction dropped an even larger 3.7% (-0.9% y/y) in July and that level is off by nearly two-thirds from its peak in early 2006. Building activity on multi-family units ticked up 0.2% (-1.7% y/y) while spending on improvements gave back the June gain and fell 1.0% (-5.5% y/y).
During the last twenty years there has been an 84% correlation between the q/q change in the value of residential building and its contribution to growth in real GDP.
The value of nonresidential building activity fell 0.7% after
increasing in each month of this year. Despite the latest dip, office
construction continued firm and increased 1.7% (13.7% y/y). Lodging
spending dipped, however, by 0.1% but it was up by more than one-third
from last year's level. Spending on multi-retail building rose 3.1%
(4.7% y/y) while spending on health care facilities dipped 0.2% (+6.7%
y/y).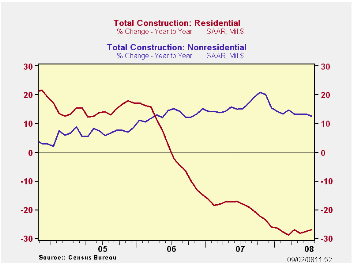
Public construction continued firm and rose by 1.4% (8.1% y/y). The value of construction spending on highways & streets fell modestly for the third consecutive month but remained up 6.9% from last year. (The value of construction on highways & streets is roughly one third of the value of total public construction spending.) Building activity of educational facilities surged 2.5% (7.4% y/y) during July.
The more detailed categories of construction represent the Census Bureau’s reclassification of construction activity into end-use groups. Finer detail is available for many of the categories; for instance, commercial construction is shown for automotive sales and parking facilities, drugstores, building supply stores, and both commercial warehouses and mini-storage facilities. Note that start dates vary for some seasonally adjusted line items in 2000 and 2002 and that constant-dollar data are no longer computed.
The United States in the International Financial System: A Separate Reality? Resolving Two Puzzles in the International Accounts is yesterday's speech by Fed Governor Randall S. Kroszner and it can be found here.
Regional Variation in the Potential Economic Effects of Climate Change from the Federal Reserve Bank of San Francisco is available here.
| Construction (%) | July | June | Y/Y | 2007 | 2006 | 2005 |
|---|---|---|---|---|---|---|
| Total | -0.6 | 0.3 | -4.8 | -2.7 | 6.3 | 11.2 |
| Private | -1.4 | 0.2 | -9.2 | -6.9 | 5.5 | 12.7 |
| Residential | -2.3 | -1.4 | -27.5 | -19.8 | 1.0 | 14.9 |
| Nonresidential | -0.7 | 1.7 | 16.0 | 19.6 | 16.2 | 7.8 |
| Public | 1.4 | 0.4 | 8.1 | 12.3 | 9.3 | 6.2 |
by Tom Moeller September 2, 2008
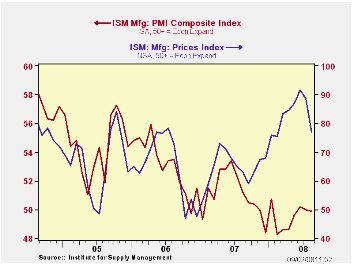
The Institute for Supply Management reported that it's Composite Index of Manufacturing Sector Activity was about unchanged from its July level at 49.9. It thus remained up slightly from the monthly lows near 48 this past winter. Consensus expectations had been for more of a decline to 49.1 in July.
Despite the very recent improvement, the index's average level so far this year of 49.5 was near its lowest since early-2003. The index level is consistent with a roughly unchanged level in industrial sector activity.
During the last twenty years there has been a 64% correlation
between the level of the Composite Index and the three-month growth in
factory sector industrial production.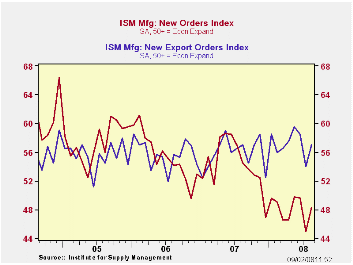
It is appropriate to correlate the ISM index level with factory sector growth because the ISM index is a diffusion index. It measures growth by using all of the positive changes in activity added to one half of the zero change in activity measures.
The new orders index recovered most of its sharp drop in July. However, the two month average of the index at 46.6 was near this cycle's low. The new export orders sub-series recovered most of its July drop with a 3.0 point rise to 57.0. During the last ten years there has been a 53% correlation between the index and the q/q change in real exports of goods in the GDP accounts.
The employment index fell 2.2 points to 49.7 but that retraced just a piece of the July rise. During the last twenty years there has been a 67% correlation between the level of the ISM employment index and the three-month growth in factory sector employment.
The production index dipped to 52.1 and still indicated a
rising level of output. The inventories series rose sharply to 49.3 and
that recovered most of its July decline.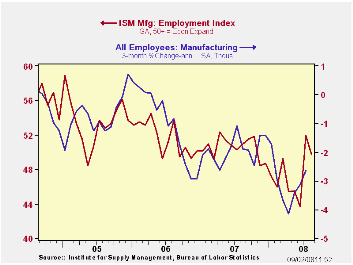
Order backlogs remained near the lowest level (43.5) this year as the index rose just slightly in August. It averaged 48.9 during all of 2007.
Prices paid fell sharply. The index fell 11.5 points to 77.0, its lowest level since February. That followed the recent decline in oil prices. During the last twenty years there has been a 79% correlation between the price index and the three-month change in the PPI for intermediate goods.
Oil and the U.S. macroeconomy: an update and a simple forecasting exercise from the Federal Reserve Bank of St. Louis can be found here.
The Menace of Inflation from the Center for Economic and Policy Research is available here.
| ISM Mfg | August | July | August '07 | 2007 | 2006 | 2005 |
|---|---|---|---|---|---|---|
| Composite Index | 49.9 | 50.0 | 51.2 | 51.1 | 53.1 | 54.4 |
| New Orders Index | 48.3 | 45.0 | 54.5 | 54.3 | 55.4 | 57.4 |
| Employment Index | 49.7 | 51.9 | 50.9 | 50.5 | 51.7 | 53.6 |
| Prices Paid Index (NSA) | 77.0 | 88.5 | 63.0 | 64.6 | 65.0 | 66.4 |
by Robert Brusca September 2, 2008
The July PPI in the e-zone jumped by 1.1% in July continuing to spread inflation pressure in the e-zone. Ex energy the PPI rose by 0.5% after a 0.4% spurt in June. As a result even ex-energy inflation is looking troublesome. Ex energy e-Zone inflation is running at 4.3% Yr/Yr, at a 5.1% pace over six months and at a barely reduced 4.7% pace over three months. While this is the PPI not the ECB’s favored HICP measure, the strength in prices will not go down well at the ECB. Germany, Italy and the UK generally show accelerating patterns of headline PPI inflation as well as ex-energy inflation. Among those three only Italy does not show inflation accelerating over the recent three months compared to six months and 12-months for ex-energy inflation.
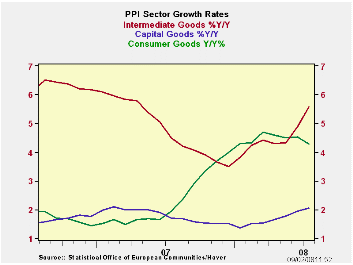
The e-zone headline inflation rate for the PPI is now up by 9% Yr/Yr compared with ex-energy inflation at 4.7%. Capital goods inflation remains subdued at 2% Yr/Yr. But consumer goods inflation is up by 4.3%. Energy prices are up 24% Yr/Yr. Inflation trends in the e-zone are like nothing the ECB would ever want to tolerate, but here they are.
| E-zone and UK PPI Trends | ||||||
|---|---|---|---|---|---|---|
| M/M | Saar | |||||
| Euro Area 15 | Jul-08 | Jun-08 | 3-Mo | 6-MO | Yr/Yr | Y/Y Yr Ago |
| TotalxConstruct | 1.1% | 1.0% | 14.2% | 11.8% | 9.0% | 1.8% |
| Excl Energy | 0.5% | 0.4% | 4.7% | 5.1% | 4.3% | 2.9% |
| Capital Gds | 0.2% | 0.2% | 2.3% | 2.5% | 2.0% | 1.7% |
| Consumer Gds | 0.2% | 0.2% | 2.3% | 2.9% | 4.3% | 1.9% |
| Intermediate&Cap Gds | 0.6% | 0.5% | 5.9% | 6.3% | 4.2% | 3.4% |
| Energy | 2.8% | 2.8% | 46.3% | 33.5% | 24.5% | -1.8% |
| MFG | 0.6% | 0.7% | 10.9% | 9.6% | 7.2% | 2.3% |
| Germany | 2.0% | 0.9% | 16.7% | 13.4% | 8.9% | 1.1% |
| ExEnergy | 0.7% | 0.3% | 5.4% | 5.1% | 3.6% | 2.4% |
| Italy | 0.5% | 0.8% | 11.4% | 10.4% | 8.3% | 2.0% |
| ExEnergy | 0.1% | 0.5% | 3.4% | 5.1% | 4.1% | 3.1% |
| UK | 0.2% | 2.9% | 25.3% | 20.9% | 20.0% | 0.2% |
| ExEnergy | 0.5% | 0.8% | 11.6% | 10.3% | 7.6% | 3.0% |
| Euro Area 15 Harmonized PPI excluding Construction. | ||||||
| The EA 15 countries are Austria, Belgium, Cyprus, Finland, France, Germany, Greece, Ireland, Italy, Luxembourg, Malta, Netherlands, Portugal, Slovenia and Spain. | ||||||
by Louise Curley September 2, 2008
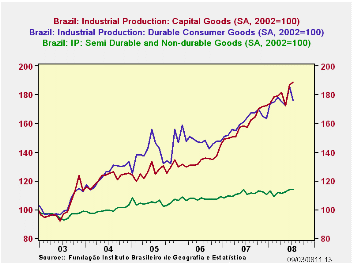
Brazilian industrial production rose 1% in July from June and
was 7% above July, 2007. Capital goods production was up 20% over July
2007. Consumer durable goods production was up 7.5% and consumer
semidurable and nondurable goods production was up 3%. The first chart
shows these major categories of total industrial production over the
past few years.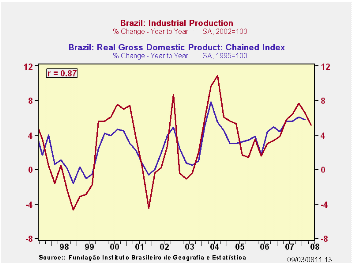
The quarterly year-to-year changes in industrial production have proven to be good indicators of the quarterly changes in real GDP as shown in the second chart where the correlation between the two series is .87 and the R2 is .76. The industrial production data precedes the GDP data by a month or more. The year-to-year increase in the second quarter industrial production was 5.1% down from the 6.6% of the first quarter when the year-to-year increase in GDP was 5.8%. If the correlation holds, we should expect a year-to-year increase of 5% second quarter increase of around 5% over the second quarter of 2007. The actual figure will be published September 10.
| BRAZIL: Industrial Production (2002=100) | Jul 08 | Jun 08 | Jul 07 | M/M % chg | Y/Y % chg | 2007 | 2006 | 2005 |
|---|---|---|---|---|---|---|---|---|
| Total | 130.63 | 129.28 | 121.63 | 1.04 | 7.40 | 121.29 | 114.98 | 111.79 |
| Capital Goods | 188.86 | 186.65 | 157.07 | 1.18 | 20.24 | 159.48 | 133.97 | 126.78 |
| Consumer Durable Goods | 176.22 | 185.81 | 163.93 | -5.16 | 7.50 | 160.92 | 148.13 | 139.99 |
| Consumer Semi and Non Durable Goods | 113.90 | 113.87 | 110.44 | 0.03 | 3.13 | 110.98 | 107.41 | 104.78 |

Tom Moeller
AuthorMore in Author Profile »Prior to joining Haver Analytics in 2000, Mr. Moeller worked as the Economist at Chancellor Capital Management from 1985 to 1999. There, he developed comprehensive economic forecasts and interpreted economic data for equity and fixed income portfolio managers. Also at Chancellor, Mr. Moeller worked as an equity analyst and was responsible for researching and rating companies in the economically sensitive automobile and housing industries for investment in Chancellor’s equity portfolio. Prior to joining Chancellor, Mr. Moeller was an Economist at Citibank from 1979 to 1984. He also analyzed pricing behavior in the metals industry for the Council on Wage and Price Stability in Washington, D.C. In 1999, Mr. Moeller received the award for most accurate forecast from the Forecasters' Club of New York. From 1990 to 1992 he was President of the New York Association for Business Economists. Mr. Moeller earned an M.B.A. in Finance from Fordham University, where he graduated in 1987. He holds a Bachelor of Arts in Economics from George Washington University.
More Economy in Brief


