 Global| Jul 01 2008
U.S. Construction Spending Down in May, 2008 Leveled
by:Tom Moeller
|in:Economy in Brief
Summary
The value of construction put in place fell 0.4% during May which was about as-expected.The decline followed a revised 0.1% April dip but data back to 2005 were revised; 4Q and 1Q sharply lower. The y/y decline of 6.0% was the weakest [...]
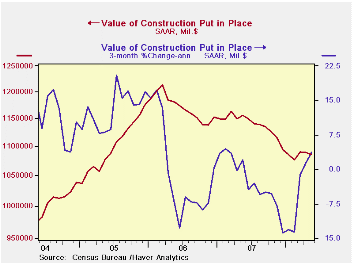
The value of construction put in place fell 0.4% during May which was about as-expected.The decline followed a revised 0.1% April dip but data back to 2005 were revised; 4Q and 1Q sharply lower. The y/y decline of 6.0% was the weakest since 1991 though this year the level of activity has leveled out.
Lower residential building activity repeated its April performance and fell 1.6%. Since its peak it has fallen by more than one-third. Single-family construction paced that decline with a 3.4% May drop and the level is off by more than one-half from the early-2006 peak level. Building activity on multi-family units edged up 0.1% (-9.5% y/y) but since the late-2006 peak activity is down 20%.
During the last twenty years there has been an 84% correlation between the q/q change in the value of residential building and its contribution to growth in real GDP.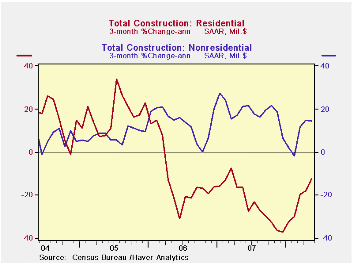
The value of nonresidential building activity nudged up 0.2% after two months of 1.6% gain. Lodging spending surged again, in May by 3.2% (42.0% y/y). Spending on educational buildings rose 0.4% (18.3% y/y) and health care activity dipped for the second month, by 0.3% in May but it was still up 8.5% y/y. Office construction activity nudged up 0.3%(16.7% Y/Y) but multi-retail building eased 0.8% (+1.9% y/y).
Public construction recouped the prior month's dip and rose 0.4%. Spending on office structures has been quite firm and rose another 1.6% (29.8% y/y) while growth in public health care facilities rose 0.8%. The strong y/y gain here of 8.0% follows 25.4% growth last year. The value of construction spending on highways & streets retraced the prior month's increase and fell 0.7% (5.2% y/y). (The value of construction on highways & streets is roughly one third of the value of total public construction spending.) Building activity of educational facilities rose 1.8% (6.6% y/y).
The more detailed categories of construction represent the Census Bureau’s reclassification of construction activity into end-use groups. Finer detail is available for many of the categories; for instance, commercial construction is shown for automotive sales and parking facilities, drugstores, building supply stores, and both commercial warehouses and mini-storage facilities. Note that start dates vary for some seasonally adjusted line items in 2000 and 2002 and that constant-dollar data are no longer computed.
Are Inflation Targets Good Inflation Forecasts? from the Federal Reserve Bank of Chicago is available here.
| Construction (%) | May | April | Y/Y | 2007 | 2006 | 2005 |
|---|---|---|---|---|---|---|
| Total | -0.4 | -0.1 | -6.0 | -2.7 | 6.3 | 11.2 |
| Private | -0.7 | -0.0 | -9.7 | -6.9 | 5.5 | 12.7 |
| Residential | -1.6 | -1.7 | -27.3 | -19.8 | 1.0 | 14.9 |
| Nonresidential | 0.2 | 1.6 | 16.6 | 19.6 | 16.2 | 7.8 |
| Public | 0.4 | -0.3 | 5.2 | 12.3 | 9.3 | 6.2 |
by Tom Moeller July 1, 2008
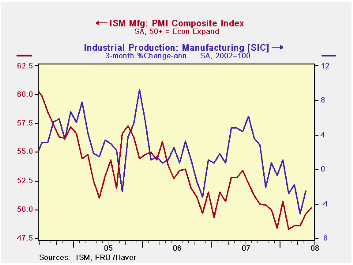
The Composite Index of Manufacturing Sector Activity, from the Institute for Supply Management, rose very slightly last month to 50.2 from an unrevised May reading of 49.6. The latest level beat Consensus expectations for 48.6.
The index's average level of 49.3 during the first half of 2008 was its lowest since early-2003.
During the last twenty years there has been a 64% correlation between the level of the Composite Index and the three-month growth in factory sector industrial production.
It is appropriate to correlate the ISM index level with factory sector growth because the ISM index is a diffusion index. It measures growth by using all of the positive changes in activity added to one half of the zero change in activity measures.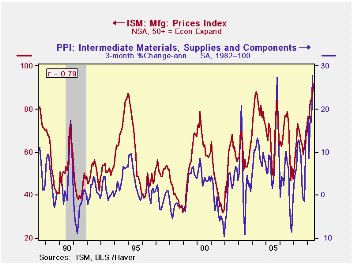
Improvement in the inventory and in the supplier deliveries indexes accounted for about all of last month's improvement in the overall index. The production index did rise slightly to its highest level since January, but employment fell to the lowest level since 2003 and production fell slightly.
During the last twenty years there has been a 67% correlation between the level of the ISM employment index and the three-month growth in factory sector employment.
The new orders index was roughly unchanged m/m at 49.6, though this year's figures are improved from last December's low.
The new export orders sub-series fell modestly m/m to 58.5 but so far this year has averaged 57.8, the best six months since mid-2004. During the last ten years there has been a 53% correlation between the index and the q/q change in real exports of goods in the GDP accounts.
Prices paid rose further as the index rose to 91.5, its highest level since 1979 (no typo). During the last twenty years there has been a 79% correlation between the price index and the three-month change in the PPI for intermediate goods.
| ISM Mfg | June | May | June '07 | 2007 | 2006 | 2005 |
|---|---|---|---|---|---|---|
| Composite Index | 50.2 | 49.6 | 53.4 | 51.1 | 53.1 | 54.4 |
| New Orders Index | 49.6 | 49.7 | 58.5 | 54.3 | 55.4 | 57.4 |
| Employment Index | 43.7 | 45.5 | 50.8 | 50.5 | 51.7 | 53.6 |
| Prices Paid Index (NSA) | 91.5 | 87.0 | 68.0 | 64.6 | 65.0 | 66.4 |
by Tom Moeller July 1, 2008
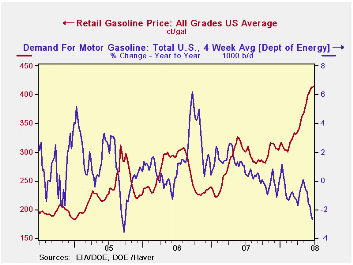
The retail price for a gallon of regular gasoline crept two cents higher last week to $4.10 per gallon, according to the U.S. Department of Energy survey. For all grades of gasoline the average price also moved two cents higher an average $4.15 per gallon.
Yesterday, the spot market price for a gallon of regular gasoline remained at $3.34 per gallon, about where it has been since early June.
Weekly gasoline prices can be found in Haver's WEEKLY database, daily prices are in the DAILY database.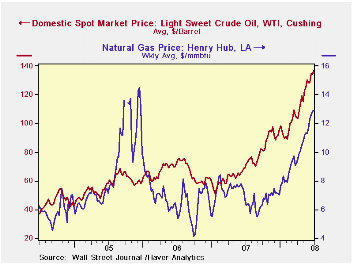
According to the U.S. Department of Energy the demand for gasoline during the latest four weeks fell 2.7% from a year earlier due to the increase in gasoline prices, along with the slowdown in economic growth. That was the weakest reading for gasoline demand in three years.
The DOE figures are available in Haver's OILWKLY database.
Yesterday the price for a barrel of West Texas Intermediate crude oil reached $140.00 per barrel versus an averge of $137.25 during all of last week.
Price for natural gas also have been quite strong and last week rose to $12.894 per mmbtu, near the record high reached in late-2005.
Consumer Sentiment and Consumer Spending from the Federal Reserve Bank of San Francisco can be found here.
| Weekly Prices | 06/30/08 | 06/23/08 | Y/Y | 2007 | 2006 | 2005 |
|---|---|---|---|---|---|---|
| Retail Regular Gasoline ($ per Gallon) | 4.10 | 4.08 | 38.4% | 2.80 | 2.57 | 2.27 |
| Light Sweet Crude Oil, WTI ($ per bbl.) | 137.25 | 134.37 | 98.4% | 72.25 | 66.12 | 56.60 |
by Tom Moeller July 1, 2008
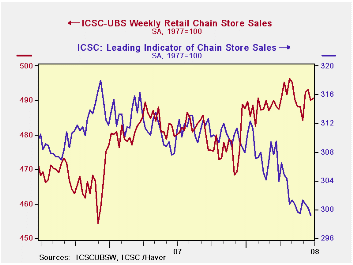
The ICSC-UBS retail chain-store sales index is constructed using the same-store sales (stores open for one year) reported by 78 stores of seven retailers: Dayton Hudson, Federated, Kmart, May, J.C. Penney, Sears and Wal-Mart.
During the latest week, the leading indicator of chain store sales from ICSC-UBS fell again, by 0.4% (-2.8% y/y).The chain store sales figures are available in Haver's SURVEYW database.
| ICSC-UBS (SA, 1977=100) | 06/28/08 | 06/21/08 | Y/Y | 2007 | 2006 | 2005 |
|---|---|---|---|---|---|---|
| Total Weekly Chain Store Sales | 490.7 | 490.0 | 2.2% | 2.8% | 3.3% | 3.6% |
by Louise Curley July 1, 2008
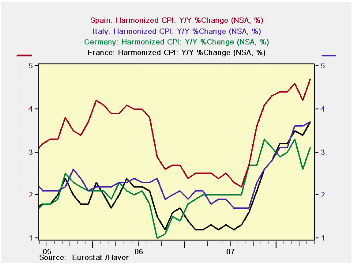
The European Central Bank (ECB) meets on this Thursday, July 3rd. It is expected to raise the base rate of 4% by 25 basis points. Yesterday, Eurostat, the European Union's Statistical office announced that inflation data for the Euro Area as a whole was 4% in June, fully 2% above the ECB's target of 2%. June data for the individual countries of the Euro Area are not yet available, but the first chart showing steady rises in the rates of inflation in Germany, France, Italy and Spain from mid 2007 through May of this year is enough to suggest action by the central bank may be forthcoming.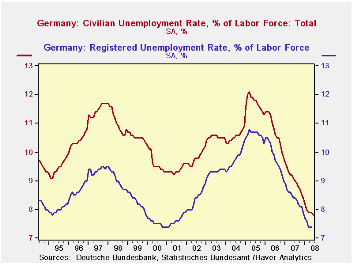
If the ECB were looking for additional data to shore up their decision to raise rates, they might consider the decline in Germany's unemployment rate, released today. Instead of rising as expected, the rate of registered unemployment fell to 7.8% in June from 7.9%. This is the lowest rate of unemployment in Germany since 2001, as can be seen in the second chart, showing the registered rate of unemployment together with the widely used International Labor Organization ILO rate. The registered rate of unemployment is typically higher than that of the (ILO) as the former includes those with a new job, but not yet at work and those working less than 15 hours a week, both of which are excluded in the ILO definition of unemployment.
| EUR0 AREA INFLATION (y/y % change in CPI) |
Jun 08 | May 08 | Apr 08 | Mar 08 | Feb 08 | Jan 08 | 2007 | 2006 | 2005 |
|---|---|---|---|---|---|---|---|---|---|
| Euro Area | 4.0 | 3.7 | 3.3 | 3.6 | 3.3 | 3.2 | 2.1 | 2.2 | 2.2 |
| Germany | -- | 3.1 | 2.6 | 3.3 | 3.0 | 2.9 | 2.2 | 1.8 | 1.9 |
| France | -- | 3.7 | 3.4 | 3.5 | 3.2 | 3.2 | 1.6 | 1.9 | 1.9 |
| Italy | -- | 3.7 | 3.6 | 3.6 | 3.1 | 3.1 | 2.0 | 2.2 | 2.2 |
| Spain | -- | 4.7 | 4.2 | 4.6 | 4.4 | 4.4 | 2.8 | 3.6 | 3.4 |
| UNEMPLOYMENT RATES (%) GERMANY | |||||||||
| Registered | 7.8 | 7.9 | 7.9 | 7.9 | 8.0 | 8.2 | 9.0 | 10.8 | 11.7 |
| ILO | -- | 7.4 | 7.4 | 7.4 | 7.6 | 7.7 | 9.0 | 10.8 | 11.7 |
by Tom Moeller July 1, 2008
At 13.64 mil. (SAAR), U.S. sales of light vehicles in June fell 4.6% from May and they were down 13.1% from June of last year, according to the Autodata Corporation. The latest level was the lowest since early-1993 and it pulled sales down 15.8% so far this year. The level of vehicle sales also was lower than Consensus expectations for sales of 14.0M.
Overall, sales of domestically made light vehicles fell 6.0% last month and were off 19.7% YTD. They were at the lowest level since 1991.
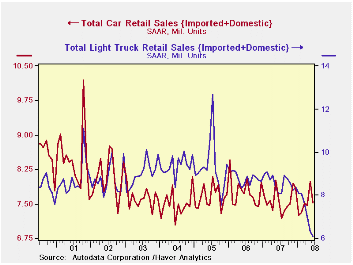
Higher gasoline prices continued to hit sales of relatively fuel inefficient domestically made light trucks. Sales fell 2.5% after May's 9.8% decline. That brought the decline this year to 27.4%. Sales of U.S. made cars reversed all of their May gain with a 9.5% decline to the lowest level in the series' history which dates back to 1990.
Sales of imported light vehicles again fell more moderately, by 1.0% to 3.93 million, after May's 0.7% decline.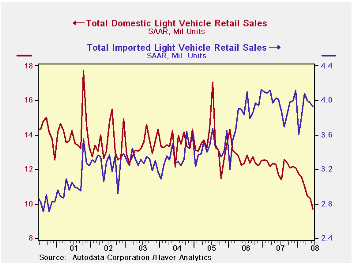
Sales of imported autos rose 1.8% following a 3.8% May gain. So far this year sales of imported cars are up 7.7%. Conversely, sales of imported light trucks also felt the effect from higher gasoline prices and fell 7.3%; off 25.5% since December.
Import's share of the U.S. light vehicle market rose again to another record level of 28.9%. (Imported vehicles are those produced outside the U.S. and does not include vehicles with the nameplate of a foreign manufacturer produced within the U.S.) Imports' share of the U.S. car market rose to a record 37.3% but import's share of the light truck market slipped from the prior month's record to 18.4%.
| Light Vehicle Sales (SAAR, Mil. Units) | June | May | Y/Y | 2007 | 2006 | 2005 |
|---|---|---|---|---|---|---|
| Total | 13.64 | 14.30 | -13.1% | 16.17 | 16.54 | 16.96 |
| Autos | 7.53 | 7.98 | -1.3% | 7.58 | 7.77 | 7.65 |
| Domestic | 4.72 | 5.22 | -7.0% | 5.07 | 5.31 | 5.40 |
| Imported | 2.81 | 2.76 | 10.0% | 2.51 | 2.45 | 2.25 |
| Light Trucks | 6.11 | 6.32 | -24.3% | 8.60 | 8.78 | 9.32 |
| Domestic | 4.98 | 5.11 | -24.6% | 7.12 | 7.42 | 8.12 |
| Imported | 1.13 | 1.21 | -22.8% | 1.48 | 1.37 | 1.20 |

Tom Moeller
AuthorMore in Author Profile »Prior to joining Haver Analytics in 2000, Mr. Moeller worked as the Economist at Chancellor Capital Management from 1985 to 1999. There, he developed comprehensive economic forecasts and interpreted economic data for equity and fixed income portfolio managers. Also at Chancellor, Mr. Moeller worked as an equity analyst and was responsible for researching and rating companies in the economically sensitive automobile and housing industries for investment in Chancellor’s equity portfolio. Prior to joining Chancellor, Mr. Moeller was an Economist at Citibank from 1979 to 1984. He also analyzed pricing behavior in the metals industry for the Council on Wage and Price Stability in Washington, D.C. In 1999, Mr. Moeller received the award for most accurate forecast from the Forecasters' Club of New York. From 1990 to 1992 he was President of the New York Association for Business Economists. Mr. Moeller earned an M.B.A. in Finance from Fordham University, where he graduated in 1987. He holds a Bachelor of Arts in Economics from George Washington University.
More Economy in Brief


