 Global| Dec 02 2009
U.S. Construction Flat In October With Downward Revisions To Prior Months
by:Tom Moeller
|in:Economy in Brief
Summary
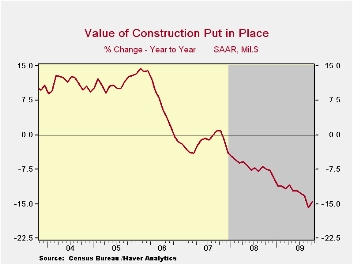
It's the same story as in prior months, only more-so. October construction spending was unchanged after revisions lowered earlier months' activity. September outlays now are reported down 1.6%, double last months' estimate. Consensus [...]
 It's the same story as in
prior months, only
more-so. October construction spending was unchanged after revisions
lowered earlier months' activity. September outlays now are reported
down 1.6%, double last months' estimate. Consensus estimates had been
for a slight uptick in October activity.
It's the same story as in
prior months, only
more-so. October construction spending was unchanged after revisions
lowered earlier months' activity. September outlays now are reported
down 1.6%, double last months' estimate. Consensus estimates had been
for a slight uptick in October activity.
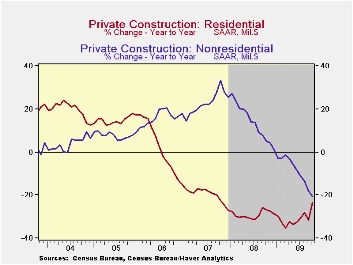 Residential
building activity
did increase 4.4%, but a September gain was revised to a 2.0% decline.
Single-family construction rose 1.9% (-30.7% y/y) for the fifth
consecutive, firm monthly increase. Spending on improvements also
firmed by 8.7% (-7.3% y/y) but September's initially reported 7.2%
increase was revised to a 5.7% decline. Multi-family building continued
down by 2.1% (-43.6% y/y) and was off 55.6% from the January 2007
peak.· Nonresidential building activity fell another 2.5% during
October after a 3.6% September decline that was double the initial
estimate. Since the 2008 peak activity has fallen by 20.6%. Spending in
the food & beverage industry declined 32.5% y/y while
expenditures in the lodging were off by nearly one-half. Commercial
building overall fell 40.0% y/y while office building dropped by more
than one-third. Relatively moderate was the y/y decline in the
education, religious and health care sectors. · Public
construction overall fell a modest 0.4% during October and y/y
expenditures actually rose though tax revenues fell. Building activity
on highways & streets fell just 0.3% m/m (+4.7% y/y) as the
nation's infrastructure received more attention. Public spending on
health care facilities reversed much of the prior month's gain with a
3.2% decline (+12.6% y/y) and building in the education sector rose
1.1% (-0.1% y/y).
Residential
building activity
did increase 4.4%, but a September gain was revised to a 2.0% decline.
Single-family construction rose 1.9% (-30.7% y/y) for the fifth
consecutive, firm monthly increase. Spending on improvements also
firmed by 8.7% (-7.3% y/y) but September's initially reported 7.2%
increase was revised to a 5.7% decline. Multi-family building continued
down by 2.1% (-43.6% y/y) and was off 55.6% from the January 2007
peak.· Nonresidential building activity fell another 2.5% during
October after a 3.6% September decline that was double the initial
estimate. Since the 2008 peak activity has fallen by 20.6%. Spending in
the food & beverage industry declined 32.5% y/y while
expenditures in the lodging were off by nearly one-half. Commercial
building overall fell 40.0% y/y while office building dropped by more
than one-third. Relatively moderate was the y/y decline in the
education, religious and health care sectors. · Public
construction overall fell a modest 0.4% during October and y/y
expenditures actually rose though tax revenues fell. Building activity
on highways & streets fell just 0.3% m/m (+4.7% y/y) as the
nation's infrastructure received more attention. Public spending on
health care facilities reversed much of the prior month's gain with a
3.2% decline (+12.6% y/y) and building in the education sector rose
1.1% (-0.1% y/y).
The construction put-in-place figures are available in Haver's USECON database.
Talking about Tomorrow’s Monetary Policy Today from the Federal Reserve Bank of San Francisco can be found here .
| Construction (%) | October | September | August | Y/Y | 2008 | 2007 | 2006 |
|---|---|---|---|---|---|---|---|
| Total | 0.0 | -1.6 | -0.9 | -14.4 | -6.9 | -1.6 | 6.3 |
| Private | 0.3 | -3.0 | -0.5 | -21.9 | -11.1 | -5.7 | 5.5 |
| Residential | 4.2 | -2.0 | 3.1 | -23.6 | -29.1 | -19.7 | 1.0 |
| Nonresidential | -2.5 | -3.6 | -2.9 | -20.6 | 13.2 | 23.1 | 16.2 |
| Public | -0.4 | 0.9 | -1.7 | 3.8 | 5.6 | 13.1 | 9.3 |

Tom Moeller
AuthorMore in Author Profile »Prior to joining Haver Analytics in 2000, Mr. Moeller worked as the Economist at Chancellor Capital Management from 1985 to 1999. There, he developed comprehensive economic forecasts and interpreted economic data for equity and fixed income portfolio managers. Also at Chancellor, Mr. Moeller worked as an equity analyst and was responsible for researching and rating companies in the economically sensitive automobile and housing industries for investment in Chancellor’s equity portfolio. Prior to joining Chancellor, Mr. Moeller was an Economist at Citibank from 1979 to 1984. He also analyzed pricing behavior in the metals industry for the Council on Wage and Price Stability in Washington, D.C. In 1999, Mr. Moeller received the award for most accurate forecast from the Forecasters' Club of New York. From 1990 to 1992 he was President of the New York Association for Business Economists. Mr. Moeller earned an M.B.A. in Finance from Fordham University, where he graduated in 1987. He holds a Bachelor of Arts in Economics from George Washington University.
More Economy in Brief


