 Global| Oct 23 2007
U.S. Chain Store Sales Lost Steam as Gasoline Prices Ticked Up
by:Tom Moeller
|in:Economy in Brief
Summary
The International Council of Shopping Centers (ICSC)-UBS reported that chain store sales last week retraced all of the prior week's rise with a 1.5% decline. That drop followed the 1.0% gain in the prior week but nevertheless was the [...]
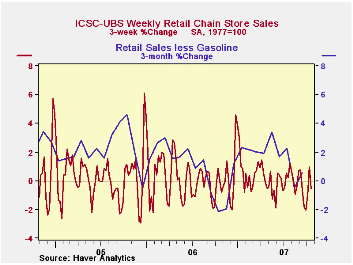
The ICSC-UBS retail chain-store sales index is constructed using the same-store sales (stores open for one year) reported by 78 stores of seven retailers: Dayton Hudson, Federated, Kmart, May, J.C. Penney, Sears and Wal-Mart.
The leading indicator of chain store sales from ICSC-UBS fell 0.2% (-0.3% y/y) after a 0.2% rise during the prior week. The decline in chain store sales accompanied a modest six cent rise in average gasoline prices across the country to $2.82 (27.9% y/y) per gallon. Higher gasoline prices followed the 4.7% m/m increase in crude oil prices so far in October to $83.47 per barrel. That rise since has backed off slightly from the daily high this month of $89.48 per barrel but only to $87.57.For yesterday's speech by Federal Reserve Board Governor Randall S. Kroszner, Recent Events in Financial Markets, please follow this link.
| ICSC-UBS (SA, 1977=100) | 10/20/07 | 10/13/07 | Y/Y | 2006 | 2005 | 2004 |
|---|---|---|---|---|---|---|
| Total Weekly Chain Store Sales | 472.9 | 480.0 | 2.2% | 3.3% | 3.6% | 4.7% |
by Louise Curley October 23, 2007
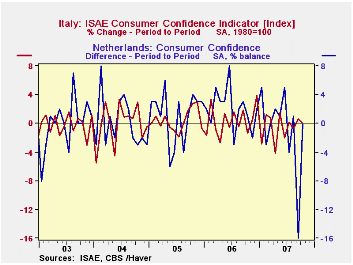
Consumer confidence held steady in the Netherlands and in Italy in October. The Dutch measure of consumer confidence had declined 16 percentage points in September, probably reflecting the turmoil in financial markets resulting from the disarray in the sub prime mortgage market in the U.S. The Italian consumer apparently, brushed off the trouble in the financial markets. Italian consumer confidence actually rose 0.7% in September to 89.9 (2000=1000) and remained there in October. The first chart shows the month to month changes in consumer confidence in the two countries. In the case of the Netherlands, the month to month changes are expressed in percentage point differences of the percent balance, and in Italy in percentage changes in an index number. The fact that the Dutch measure seems to be more volatile than that of the Italian, does not necessarily mean that the Dutch consumers are more volatile than their Italian counterparts. Percentage point changes in percent balances tend to be more volatile than percentage changes in an index number.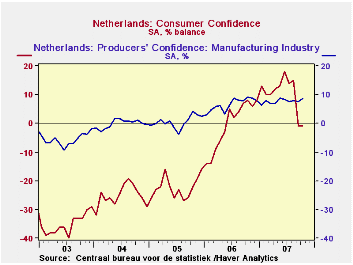
The Netherlands has also released its measure of business confidence today. Businessmen in the Netherlands have generally been more optimistic than consumers as can be seen in the second chart. Except for period from December 2006 through August of this year, business confidence has far been far higher than that of the consumer over the past five years. Business confidence increased in October to 8.6% from 7.5% in September.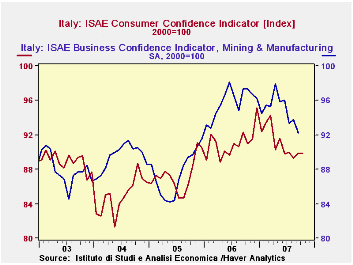
Italian business confidence will not be reported until later in the week, but the past trends of business and consumer confidence shows that businessmen, like those in the Netherlands tend to be more optimistic than consumers as can be seen in the third chart.
| CONSUMER AND BUSINESS CONFIDENCE | Oct 07 | Sep 07 | Oct 06 | M/M Chg | Y/Y Chg | 2006 | 2005 | 2004 |
|---|---|---|---|---|---|---|---|---|
| Netherlands (Percent Balance) | ||||||||
| Business Confidence | 8.6 | 7.5 | 9.0 | 1.1 | -0.4 | 6.7 | 0.6 | -0.1 |
| Consumer Confidence | -1 | -1 | 8 | 0 | -9 | -1 | -22 | -25 |
| Italy (2000=100) | ||||||||
| Business Confidence | n.a. | 92.2 | 97.3* | n.a. | -5.2 | 95.8 | 97.5 | 89.5 |
| Consumer Confidence | 89.9 | 89.9 | 91.0 | 0.0 | -1.3 | 91.1 | 87.3 | 85.0 |
| * September, 2006 | ||||||||
| n.a. not available | ||||||||
by Robert Brusca EMU Orders Begin to Show Wear and Tear October 23, 2007
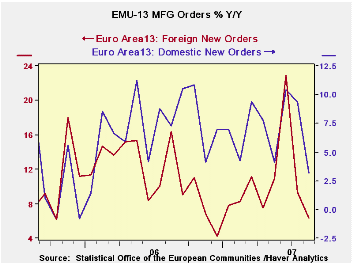
Orders growth in the new quarter is decidedly weaker; foreign orders are declining
Orders trends are starting to show some of the expected trends but the country level data are still quite mixed up as to their trends. For EMU the chart on the left shows the clear declining pace of growth for domestic as well as export orders. Export order growth is the weaker series and that has been so since early 2006. Within the Euro area MFG sales have held up and show signs of acceleration, not of weakness (see table). The table also shows that the quarter-to-date growth rates are weak for orders of various sorts. Foreign orders are falling in Q3 at an 11.7% pace. Country by country, German orders are lower in Q3, French orders are moderate, Italy and the UK are strong - the UK very strong. Basically, the country level data remain pretty erratic. Monthly patterns show that Germany’s results are driven by a sharp drop in orders in July as the new quarter started. France has two order declines in a row tempered by a surge at the end of Q2 that elevated the level of orders for Q3 and blunted the impact of the next two drops. The UK is seeing some very erratic orders off by 6.5% in August after rising by 12.7% in July. On balance the overall EMU figures give our most reliable-seeming data. They show orders slowing on a broad front with international orders the weakest. With the strong Euro and all the complaining about it, there is plenty of reason to think that these are true trends.
| Saar except m/m | % m/m | Aug-07 | Aug-07 | Aug-07 | Aug-06 | Aug-05 | Qtr-2-Date | ||
| Ezone Detail | Aug-07 | Jul-07 | Jun-07 | 3-Mo | 6-mo | 12-mo | 12-mo | 12-mo | Saar |
| MFG Orders | 0.3% | -2.6% | 3.9% | 6.2% | 8.3% | 5.9% | 10.8% | 6.9% | 2.1% |
| MFG Sales | 0.3% | 0.3% | 0.8% | 5.5% | 5.8% | 6.6% | 7.8% | 3.9% | 5.9% |
| Consumer | 0.4% | 0.4% | 0.5% | 5.2% | 4.5% | 4.7% | 7.8% | 3.9% | 5.1% |
| Capital | 0.5% | 0.6% | 0.5% | 6.6% | 6.6% | 8.2% | 4.3% | 2.1% | 6.5% |
| Intermediate | 0.6% | 0.6% | 0.8% | 10.0% | 10.3% | 3.2% | 7.0% | 3.5% | 8.6% |
| MFG Orders | |||||||||
| Total Orders | 0.3% | -2.6% | 3.9% | 6.2% | 8.3% | 5.9% | 10.8% | 6.9% | 2.1% |
| E-13 Domestic MFG orders | -0.6% | 1.2% | 1.7% | 10.0% | 10.3% | 3.2% | 7.3% | 9.6% | 11.6% |
| E-13 Foreign MFG orders | 1.5% | -9.3% | 8.4% | -0.8% | 8.6% | 6.3% | 16.4% | 7.5% | -11.7% |
| Countries: | Aug-07 | Jul-07 | Jun-07 | 3-Mo | 6-mo | 12-mo | 12-mo | 12-mo | Qtr-2-Date |
| Germany: | 1.2% | -6.3% | 5.3% | -0.9% | 4.2% | 5.1% | 17.0% | 6.6% | -8.1% |
| France: | -2.7% | -2.4% | 6.1% | 3.4% | 10.5% | 10.6% | -5.0% | 13.3% | 4.6% |
| Italy | -0.3% | -0.2% | 2.7% | 8.8% | 18.5% | 0.2% | 18.4% | 9.2% | 10.8% |
| UK | -6.5% | 12.7% | 1.5% | 30.4% | 6.5% | 3.1% | -4.3% | 25.0% | 58.1% |
by Robert Brusca October 23, 2007
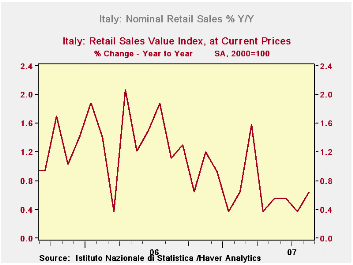
Italy’s retail sales stay on a low-growth path.
Italy’s retail sales have slowed and are staying at that slower pace. Over the past year, at 0.6%, retail sales have slowed from their previous year’s pace of 1.1%. On sequential growth rates there is a very modest up tick in growth to 1.1% over three months. Both food and clothing sales have picked up slightly on that horizon, yet both remain lower yr/yr compared to the previous year. For the new quarter, sales continue their lethargy. Nominal sales are up by almost 1% at an annual rate in the quarter with clothing lagging at a 0.6% pace and food stronger at 1.6%.
Italy’s figures are in sharp contrast with France where spending on MFG goods is up strongly by 5.8% in September from 2.9% (both y/y) in August. France’s figures for September are surprising. Italy’s results are more the sort of thing we have been seeing for some time. On balance France is the unusual signal for the whole of the Euro area since nowhere else do consumers seem to be gaining momentum. Even in France the result is in contrast to the recent industrial indicators we have seen and to the recent strike to protest a reduction in pension benefits for transport sector workers.
| Nominal | Aug-07 | Jul-07 | Jun-07 | 3-MO | 6-MO | 12-MO | Yr Ago | Q-2-Date |
| Retail Trade | 0.2% | 0.0% | 0.1% | 1.1% | 0.7% | 0.6% | 1.1% | 0.9% |
| Food Beverages & Tobacco | 0.6% | -0.1% | 0.0% | 2.1% | 1.9% | 1.3% | 1.3% | 1.6% |
| Clothing & Fur | 0.1% | -0.6% | 1.1% | 2.4% | -1.0% | -0.3% | 2.0% | 0.5% |

Tom Moeller
AuthorMore in Author Profile »Prior to joining Haver Analytics in 2000, Mr. Moeller worked as the Economist at Chancellor Capital Management from 1985 to 1999. There, he developed comprehensive economic forecasts and interpreted economic data for equity and fixed income portfolio managers. Also at Chancellor, Mr. Moeller worked as an equity analyst and was responsible for researching and rating companies in the economically sensitive automobile and housing industries for investment in Chancellor’s equity portfolio. Prior to joining Chancellor, Mr. Moeller was an Economist at Citibank from 1979 to 1984. He also analyzed pricing behavior in the metals industry for the Council on Wage and Price Stability in Washington, D.C. In 1999, Mr. Moeller received the award for most accurate forecast from the Forecasters' Club of New York. From 1990 to 1992 he was President of the New York Association for Business Economists. Mr. Moeller earned an M.B.A. in Finance from Fordham University, where he graduated in 1987. He holds a Bachelor of Arts in Economics from George Washington University.
More Economy in Brief


