 Global| Dec 04 2007
U.S. Chain Store Sales Collapsed, But Did They?
by:Tom Moeller
|in:Economy in Brief
Summary
In the biggest weekly decline since 2006, chain store sales collapsed 2.0% w/w in the final period of this year, according to the International Council of Shopping Centers (ICSC)-UBS. The decline probably is not indicative, however, [...]
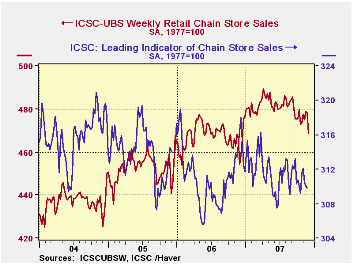
In the biggest weekly decline since 2006, chain store sales collapsed 2.0% w/w in the final period of this year, according to the International Council of Shopping Centers (ICSC)-UBS.
The decline probably is not indicative, however, of the true extent of a weakening in consumer demand. The variable timing of the Thanksgiving holiday has created similar downdrafts in this seasonally adjusted measure during the last several years. Sales in the next week, each year, have bounced back sharply.
Sales during all of November fell 0.2% from the October average which fell 0.1% from September. The latest m/m decline was the sixth in the last seven months.During the last ten years there has been a 45% correlation between the y/y change in chain store sales and the change in nonauto retail sales less gasoline.
The ICSC-UBS retail chain-store sales index is constructed using the same-store sales (stores open for one year) reported by 78 stores of seven retailers: Dayton Hudson, Federated, Kmart, May, J.C. Penney, Sears and Wal-Mart.
The leading indicator of chain store sales from ICSC-UBS fell 0.1% (-1.6% y/y) for the third consecutive weekly decline.
Market Bailouts and the "Fed Put" is last week's speech by William Poole, President of the Federal Reserve Bank of St. Louis and it is available here.
What Do You Get for "Sixteen Tons"? is analysis from the Federal Reserve Bank of St. Louis of average hourly earnings and labor income. It can be found here.
| ICSC-UBS (SA, 1977=100) | 12/011/07 | 11/24/07 | Y/Y | 2006 | 2005 | 2004 |
|---|---|---|---|---|---|---|
| Total Weekly Chain Store Sales | 468.5 | 478.2 | 3.1% | 3.3% | 3.6% | 4.7% |
by Tom Moeller December 4, 2007
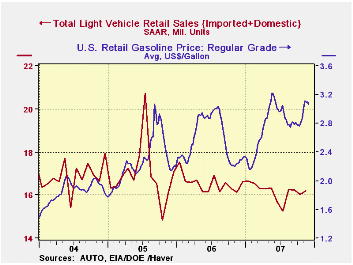
U.S. sales of light vehicles nudged up 0.9% last month to a 16.20M unit annual selling rate, according to the Autodata Corporation. The uptick followed declines in four of the prior five months. Nevertheless, sales so far in 4Q are running slightly ahead of the 3Q average due to an abysmal start to that quarter.
Sales of domestically made light vehicles improved
1.0% m/m to 12.20M units (0.1% y/y). The gain came as sales
of U.S. made cars jumped 9.9% to 5.47M units and that more than offset
a 4.8% m/m drop in sales of domestic light trucks, still feeling the
effects of higher gas prices. It was the third sharp m/m decline in
U.S. made light truck sales. 
Sales of imported light vehicles inched up 0.4% after firm gains during the prior two months. The rise to 4.00M units (1.4% y/y) was to the highest level since June. The increase was due to a 1.5% gain in sales of imported autos which was the third strong gain in as many months. Sales of imported light trucks fell a moderate 1.4% after a like increase in October.
Import's share of the U.S. light vehicle market remained stable m/m at 24.7% versus an average 23.1% for all of last year.
U.S. Economic Growth Will Be Somewhat Below Potential in 2008 according to participants of the Chicago Fed Economic Outlook Symposium and the news release is available here.
| Light Vehicle Sales (SAAR, Mil. Units) | November | October | Y/Y | 2006 | 2005 | 2004 |
|---|---|---|---|---|---|---|
| Total | 16.20 | 16.05 | 0.4% | 16.55 | 16.96 | 16.87 |
| Autos | 7.97 | 7.47 | 7.0% | 7.77 | 7.65 | 7.49 |
| Domestic | 5.47 | 5.01 | 9.9% | 5.31 | 5.40 | 5.36 |
| Imported | 2.50 | 2.46 | 1.2% | 2.45 | 2.25 | 2.14 |
| Light Trucks | 8.22 | 8.59 | -5.3% | 8.78 | 9.32 | 9.37 |
| Domestic | 6.73 | 7.07 | -6.8% | 7.42 | 8.12 | 8.15 |
| Imported | 1.49 | 1.52 | 1.9% | 1.37 | 1.20 | 1.23 |
by Robert Brusca December 3, 2007
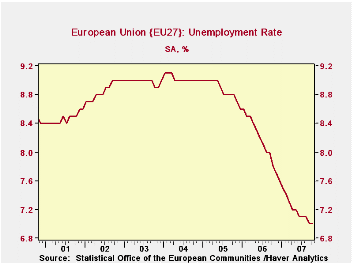
EU unemployment was steady in October as EMU unemployment
notched down one tenth of one percentage point. The chart shows that
the long steady drop in the rate of EU unemployment has hit a slowing
phase. The current rates available for the largest EMU countries show
that the tendency of the unemployment rate to drop may be slowing.
While Germany, France and Spain all post rates at 8.1%, Spain’s rate
has barely fallen in the last 12 months. Still, each of these countries
has seen some unemployment reduction in the past several months. It is
too soon to say that the drop in unemployment in Europe has stopped.
For France the drop over the past year is significant; for Germany it
has been a rather sharp drop. Spain shows signs of stalling.
| Unemployment Rate and Changes | ||||||
|---|---|---|---|---|---|---|
| Level | Simple Changes | |||||
| Unemployment Rate | Oct | Sept | Aug | 3-Mo | 6-Mo | 12-Mo |
| EU | 7.0 | 7.0 | 7.1 | -0.1 | -0.2 | -0.8 |
| EMU | 7.2 | 7.3 | 7.4 | -0.2 | -0.3 | -0.8 |
| Unemployment (000s) | m/m% | % changes (AR) | ||||
| EU | -0.6% | -0.8% | -0.5% | -1.9% | -3.6% | -10.3% |
| EMU | -0.7% | -0.7% | -0.3% | -1.7% | -2.7% | -8.1% |
| Unemployment Rates | Oct | Sept | Aug | 3-Mo | 6-Mo | 12-Mo |
| Germany | 8.1 | 8.2 | 8.3 | -0.3 | -0.4 | -1.3 |
| France | 8.1 | 8.2 | 8.3 | -0.2 | -0.4 | -0.8 |
| Spain | 8.1 | 8.2 | 8.2 | -0.1 | 0 | -0.2 |
by Robert Brusca December 4, 2007
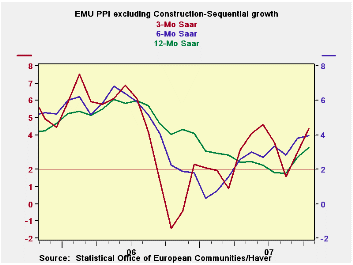
The EMU ex construction PPI chart shows a clear pattern of
acceleration. The PPI (excluding construction) has a 3-month rate in
excess of its six-month pace that is, in turn, above the Yr/Yr pace.
That is acceleration by definition. All measures are well above the
hypothetical ceiling rate of inflation of 2% (that ceiling applies to
the HICP alone, however). Still, having PPI inflation at this strong of
a pace must be disconcerting to the ECB.
More disconcerting is for ex-energy inflation to show that
same sort of accelerating pattern: 3-month inflation, at 3.4%, exceeds
6-month inflation, at 3%, and that pace is only a tick below the
12-month pace at 3.1%. All of these speeds are above the 2% mark and
therefore excessive.
These sorts of ‘cost pressures’ in turn feed into the CPI in a
way that is unhealthy. It is hard for the CPI (HICP) to maintain a sub
2% pace if the things that go into it, or that underlie it, are
speeding ahead faster. Consumer goods inflation is a major culprit with
inflation on a steady sequential acceleration and a three-month pace of
6.4%. Of course energy and all its pressures are embodied in that
measure. Intermediate goods inflation has been quieting down with the
opposite tendency, revealing deceleration with inflation below 2% over
the recent three months at 1.7%. Capital goods inflation is at 1.1% and
also has been decelerating, but not uniformly.
Among the larger EU countries, Germany shows overall and
Ee-energy PPI inflation that is excessive and accelerating. Italy shows
an excessive and accelerating PPI and an ex-energy inflation that is
over the 2% mark but not worsening. The UK shows a greatly accelerating
headline PPI while ex-energy producer price pressures are clear but a
bit less strident.
On balance, the ECB has a PPI report that will give it little
sense of relief. The EMU PPI components make inflation appear a bit
more like it is a consumer sector problem in the main. That is curious
since that has been such a weak sector in EMU while the capital goods
sector has been vibrant and yet there inflation remains tame and is
ensconced well within its preferred range. All this leave the ECB in a
quandary that only worsens when you look at the foreign exchange market
and consider, too, the loss of momentum growth has been seeing in the
region.
| Euro area and UK PPI Trends | ||||||
|---|---|---|---|---|---|---|
| M/M | Saar | |||||
| Ezone-13 | Oct-07 | Sep-07 | 3-Mo | 6-MO | Yr/Yr | Y/Y Yr Ago |
| Total excl Construction | 0.6% | 0.4% | 4.5% | 3.7% | 3.3% | 4.0% |
| Excl Energy | 0.4% | 0.2% | 3.4% | 3.0% | 3.1% | 3.6% |
| Capital Goods | 0.1% | 0.1% | 1.1% | 0.9% | 1.5% | 1.7% |
| Consumer Goods | 0.6% | 0.5% | 6.4% | 4.8% | 3.4% | 1.7% |
| Intermediate & Capital Goods | 0.2% | 0.1% | 1.7% | 2.0% | 3.0% | 4.5% |
| Energy | 1.7% | 1.0% | 9.1% | 6.7% | 4.0% | 5.2% |
| MFG | 0.5% | 0.4% | 4.0% | 4.0% | 3.9% | 2.5% |
| Germany | 0.4% | 0.2% | 2.7% | 2.2% | 1.7% | 4.6% |
| Germany ex Energy | 0.4% | 0.0% | 2.9% | 2.4% | 2.4% | 3.0% |
| Itlay | 0.4% | 0.5% | 4.7% | 4.0% | 3.6% | 4.9% |
| Italy ex Energy | 0.2% | 0.2% | 2.4% | 2.4% | 3.1% | 4.4% |
| UK | 2.2% | 1.2% | 14.3% | 9.7% | 3.9% | 5.4% |
| UK ex Energy | 0.4% | 0.2% | 3.2% | 2.9% | 3.2% | 3.3% |
| E-zone 13 Harmonized PPI excluding Construction | ||||||
| The EA 13 countries are Austria, Belgium, Finland, France, Germany, | ||||||
| Greece, Ireland, Italy, Luxembourg, the Netherlands, Portugal, Slovenia | ||||||
by Louise Curley December 4, 2007
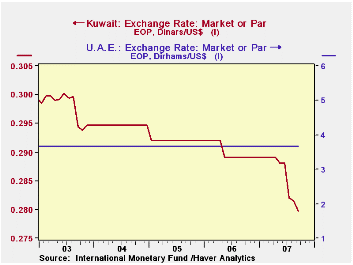
The countries included in the Gulf Cooperation Council (GCC)--Saudi Arabia, Bahrain, Kuwait, Oman, Qatar and the United Arab Emirates--have, with the exception of Kuwait, pegged their currencies to the U. S dollar for over the past ten years or so. Kuwait has allowed its currency to float in a narrow band but, in May of this year, formally abandoned the dollar peg and switched to a basket of currencies. The UAE's dirhams per us dollar, as an example of the stability in the exchanges of all the five non Kuwaiti currencies and Kuwait's dinars per dollar are shown in the first chart. By the end of September, the Kuwaiti dinar had appreciated by slightly more than 4% since the peg was abandoned.
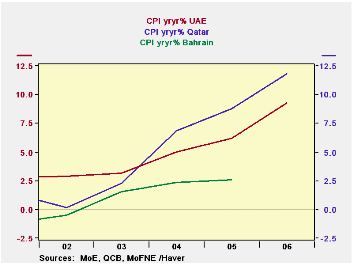
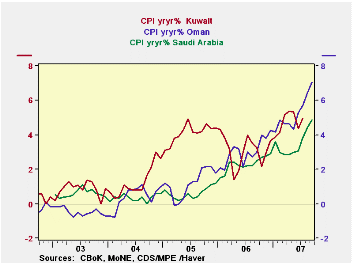
At the conclusion of the recent GCC annual meeting, the Qatari Prime Minister, Sheikh Hamad bin Jassem al-Thani said the group, excluding Kuwait, had decided to keep the dollar peg. However, doubts regarding the resolve of the individual countries have begun to surface. All six of the gulf countries have been experiencing rapid and rising price increases. For the three countries that report monthly data, year to year price increases are running between 5 and 7% as shown in the second chart. Current data for inflation in Bahrain is woefully lacking. The latest report is for the year 2005. While the consumer price index rose only 2.6%, this represented a substantial change from the deflation that had taken place earlier. Current inflation data for Qatar and the U.A.E are also scarce, but the recent annual data are of concern. In 2006, the consumer price index rose 9% in the U.A.E. and 12% in Qatar. The inflation rates for the three countries that have only annual data are shown in the third chart. Inflation pressures were a factor in Kuwait's decision to abandon it peg in May.
Data on the GCC countries can be found in the country sourced
data in the EMERGEMA database and in the IFS
database.
| GULF COOPERATION COUNCIL | Sep 07 | Aug 07 | Jul 06 | Jun 06 | 2006 | 2005 | 2004 | 2003 | 2002 |
|---|---|---|---|---|---|---|---|---|---|
| INFLATION | |||||||||
| Bahrain | n.a. | n.a. | n.a. | n.a. | 2.6 | 2.4 | 1.6 | -0.5 | |
| Kuwait | n.a. | n.a. | 5.0 | 4.5 | 3.1 | 4.1 | 1.2 | 0.9 | 0.5 |
| Oman | 7.1 | 6.5 | 5.7 | 5.3 | 3.0 | 1.2 | 0.4 | -0.6 | n.a. |
| Qatar | n.a. | n.a. | n.a. | n.a. | 11.8 | 8.8 | 6.8 | 2.3 | 0.2 |
| Saudi Arabia | 3.0 | 3.1 | 3.8 | 4.4 | 2.3 | 0.6 | 0.4 | 0.6 | n.a. |
| United Arab Emirates | n.a. | n.a. | n.a. | n.a. | 9.3 | 6.2 | 5.0 | 3.1 | 2.9 |

Tom Moeller
AuthorMore in Author Profile »Prior to joining Haver Analytics in 2000, Mr. Moeller worked as the Economist at Chancellor Capital Management from 1985 to 1999. There, he developed comprehensive economic forecasts and interpreted economic data for equity and fixed income portfolio managers. Also at Chancellor, Mr. Moeller worked as an equity analyst and was responsible for researching and rating companies in the economically sensitive automobile and housing industries for investment in Chancellor’s equity portfolio. Prior to joining Chancellor, Mr. Moeller was an Economist at Citibank from 1979 to 1984. He also analyzed pricing behavior in the metals industry for the Council on Wage and Price Stability in Washington, D.C. In 1999, Mr. Moeller received the award for most accurate forecast from the Forecasters' Club of New York. From 1990 to 1992 he was President of the New York Association for Business Economists. Mr. Moeller earned an M.B.A. in Finance from Fordham University, where he graduated in 1987. He holds a Bachelor of Arts in Economics from George Washington University.
More Economy in Brief


