 Global| Aug 13 2008
U.S. Business Inventory Gain the Strongest Since January Distorted by Oil Prices
by:Tom Moeller
|in:Economy in Brief
Summary
Total business inventories jumped 0.7% during June after an upwardly revised 0.4% May increase. The latest increase exceeded Consensus expectations for a 0.5% rise and it was the strongest gain since January. The three-month growth in [...]
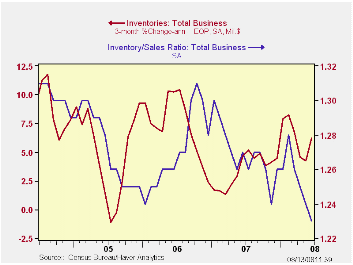
Total business inventories jumped 0.7% during June after an upwardly revised 0.4% May increase. The latest increase exceeded Consensus expectations for a 0.5% rise and it was the strongest gain since January. The three-month growth in inventories rose to 6.2% (AR) from roughly 4% during the prior two months.
Higher wholesale inventories led the gain the total with a 1.1% jump during June and at a 14.1% rate during the last three months, again boosted by the rise in oil prices. Nevertheless, less petroleum wholesale inventories rose at a 12.0% rate during those three months which was more than twice the rate of increase during all of last year.
Retail inventories fell 0.1% after a revised 0.3% May decline. The drops left the three-month growth rate negative at -0.5% reflecting the draw-down of automobile inventories. Inventories of motor vehicle & parts fell at a 6.2% annual rate during the last three months due to further production cutbacks. Outside of autos, retail inventories rose at a 2.2% rate over the last three months and that reversed three months of decumulation.
The industry detail in the retail sector indicated that lower apparel inventories led the recent weakness in the total with a 0.9% rate of decline. Furniture inventories rose at a 3.9% rate during the last three months and general merchandise inventories rose at a 2.3% rate. Both of these gains reverse prior declines. Clothing & accessory store inventories still fell at a 0.9% rate over the last three months after an 8.1% rate of decline back in March.
Factory inventories jumped 1.0% and that left the three-month rate of accumulation steady at 6.4%.
Total business sales jumped another 1.7% led higher by the rise in oil prices which lifted factory sales by 1.6%.
| Business Inventories | June | May | Y/Y | 2007 | 2006 | 2005 |
|---|---|---|---|---|---|---|
| Total | 0.7% | 0.4% | 5.6% | 3.8% | 5.9% | 6.0% |
| Retail | -0.1% | -0.3% | 0.9% | 2.6% | 3.5% | 2.3% |
| Retail excl. Auto | 0.1% | -0.1% | 1.3% | 2.7% | 4.9% | 3.9% |
| Wholesale | 1.1% | 0.9% | 9.5% | 5.5% | 8.3% | 7.3% |
| Manufacturing | 1.0% | 0.6% | 7.0% | 3.7% | 6.4% | 8.9% |

Tom Moeller
AuthorMore in Author Profile »Prior to joining Haver Analytics in 2000, Mr. Moeller worked as the Economist at Chancellor Capital Management from 1985 to 1999. There, he developed comprehensive economic forecasts and interpreted economic data for equity and fixed income portfolio managers. Also at Chancellor, Mr. Moeller worked as an equity analyst and was responsible for researching and rating companies in the economically sensitive automobile and housing industries for investment in Chancellor’s equity portfolio. Prior to joining Chancellor, Mr. Moeller was an Economist at Citibank from 1979 to 1984. He also analyzed pricing behavior in the metals industry for the Council on Wage and Price Stability in Washington, D.C. In 1999, Mr. Moeller received the award for most accurate forecast from the Forecasters' Club of New York. From 1990 to 1992 he was President of the New York Association for Business Economists. Mr. Moeller earned an M.B.A. in Finance from Fordham University, where he graduated in 1987. He holds a Bachelor of Arts in Economics from George Washington University.
More Economy in Brief


