 Global| Feb 12 2009
U.S. Business Inventory Cutbacks Gained Steam
by:Tom Moeller
|in:Economy in Brief
Summary
Total business inventories fell 1.3% during December after a downwardly revised November decline. The latest drop was the fourth in as many months and the rise of 0.9% year-to-year was the weakest since early-2004. The recent cutback [...]
 Total business inventories fell 1.3% during December after a
downwardly revised November decline. The latest drop was the
fourth in as many months and the rise of 0.9% year-to-year was the
weakest since early-2004. The recent cutback in inventory accumulation
reflects the 11.8% y/y drop in business sales. During the
last three months inventories have been cut at an 11.4% rate as sales
have fallen at a 40.9% annual rate. The mismatch
between inventory and sales growth caused the December inventory/sales
ratio to surge further to 1.44, its highest level since the recession
of 2001. What's more is that the increase in the ratio during
the last year is the swiftest since 1982. The rise ended a twenty-eight
year downtrend.
Total business inventories fell 1.3% during December after a
downwardly revised November decline. The latest drop was the
fourth in as many months and the rise of 0.9% year-to-year was the
weakest since early-2004. The recent cutback in inventory accumulation
reflects the 11.8% y/y drop in business sales. During the
last three months inventories have been cut at an 11.4% rate as sales
have fallen at a 40.9% annual rate. The mismatch
between inventory and sales growth caused the December inventory/sales
ratio to surge further to 1.44, its highest level since the recession
of 2001. What's more is that the increase in the ratio during
the last year is the swiftest since 1982. The rise ended a twenty-eight
year downtrend.
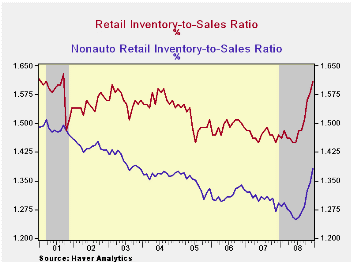
Retailers cut inventories 1.0% in December and at an
11.7% rate during the last three months, the swiftest since
2001.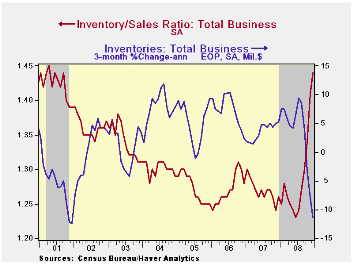 Motor vehicle inventories continued to lead the
decumulation and fell at a 15.8% rate during the last three months.
Nevertheless, the inventory-to-sales ratio for automobiles remained
near its historic high at 2.59. So unless sales recover soon, expect
further production cuts to reduce the ratio.
Motor vehicle inventories continued to lead the
decumulation and fell at a 15.8% rate during the last three months.
Nevertheless, the inventory-to-sales ratio for automobiles remained
near its historic high at 2.59. So unless sales recover soon, expect
further production cuts to reduce the ratio.
Outside of autos, retailers continued with their reduction of unsold goods. Furniture, home furnishings & electronics inventories fell 1.2% in December and they are off 5.5% during the past year. Apparel retailers cut aggressively as well. The 0.6% December decline matched the November inventory cutback and they're off 2.5% year-to-year. General merchandise inventories fell 1.1% (-2.7% y/y) during December. Overall, the inventory-to-sales ratio in the nonauto retail sector rose during December to its highest level since 2003.
| Business Inventories (%) | December | November | October | Y/Y | 2008 | 2007 | 2006 |
|---|---|---|---|---|---|---|---|
| Total | -1.3 | -1.1 | -0.6 | 0.9 | 0.9 | 4.1 | 6.5 |
| Retail | -1.0 | -1.8 | -0.2 | -2.8 | -2.8 | 2.9 | 3.5 |
| Retail excl. Auto | -1.0 | -1.5 | -0.1 | -1.5 | -1.5 | 2.9 | 4.9 |
| Wholesale | -1.4 | -0.9 | -1.2 | 3.4 | 3.4 | 5.9 | 8.3 |
| Manufacturing | -1.4 | -0.5 | -0.6 | 2.6 | 2.6 | 3.7 | 8.2 |

Tom Moeller
AuthorMore in Author Profile »Prior to joining Haver Analytics in 2000, Mr. Moeller worked as the Economist at Chancellor Capital Management from 1985 to 1999. There, he developed comprehensive economic forecasts and interpreted economic data for equity and fixed income portfolio managers. Also at Chancellor, Mr. Moeller worked as an equity analyst and was responsible for researching and rating companies in the economically sensitive automobile and housing industries for investment in Chancellor’s equity portfolio. Prior to joining Chancellor, Mr. Moeller was an Economist at Citibank from 1979 to 1984. He also analyzed pricing behavior in the metals industry for the Council on Wage and Price Stability in Washington, D.C. In 1999, Mr. Moeller received the award for most accurate forecast from the Forecasters' Club of New York. From 1990 to 1992 he was President of the New York Association for Business Economists. Mr. Moeller earned an M.B.A. in Finance from Fordham University, where he graduated in 1987. He holds a Bachelor of Arts in Economics from George Washington University.
More Economy in Brief


