 Global| Mar 19 2008
U.S. Business Inventories Starting to Back Up
by:Tom Moeller
|in:Economy in Brief
Summary
The Commerce Department reported that for January total business inventories rose 0.8% after an upwardly revised 0.7% rise in December. The annualized three month growth in inventories rose as a result to 7.7%, its strongest since [...]
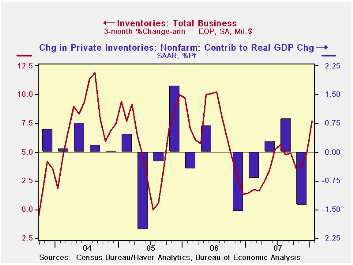
The Commerce Department reported that for January total business inventories rose 0.8% after an upwardly revised 0.7% rise in December. The annualized three month growth in inventories rose as a result to 7.7%, its strongest since mid-2006. The quicker rate of accumulation, if sustained, would reverse much of the -1.4 percentage point contribution inventories made to 4Q07 growth in real GDP.
A quicker rate of accumulation of factory inventories accounts
for much of the acceleration. In January they surged by 1.3% after a
strong 0.9% December increase. Together they raised the three month
rate of accumulation to 12.0%, up from 7.2% during 4Q07. Higher oil
prices were behind some of that faster rate of gain as petroleum
inventories rose 8.1% in January (29.7% y/y). Nevertheless, excluding
petroleum factory inventories still increased a firm 0.8% during
January, the same as in the prior month, and the three month rate of
accumulation rose to 8.8%, up from the 5.9% 4Q rate of gain and from
the 1.7% 3Q rise.
Retail inventories are up, but the rate of gain shows a less
pronounced acceleration due to auto cutbacks. During January total
retail inventories rose 0.4% after no change in December. The three
month rate of increase was a minimal 0.7% after a 0.2% 4Q rise.
Inventories of motor vehicle & parts rose just 0.4% in January
after four consecutive months of decline. As a result motor vehicle
inventories during the last three months fell at a 4.8% rate after an
8.0% 4Q drop. Motor vehicle inventories were reduced as production was
cut back. Outside of autos retail inventories were well behaved through
January and rose just 0.4%, half the December rise. That lowered the
three month growth rate to 3.3% from 4.3% during 4Q.
The industry detail in the retail sector shows that building materials inventories grew at a 6.4% rate over the last three months versus a 7.6% 4Q gain. Furniture inventories fell at a 5.7% rate after a 2.3% 4Q rise. At clothing & accessory stores the three month rate of accumulation of 0.4% offset a 0.3% rate of decumulation during 4Q. General merchandise stores' inventories rose at a 0.8% rate over the last three months following decumulation at a 1.7% rate during 4Q.
The gains in wholesale inventories have been strong, rising 0.8% in January after a 1.1% December rise. Curiously, the value of inventories of petroleum products fell 3.4% in January and offset half of the prior month's increase. Less petroleum wholesale inventories rose a strong 1.0% and the three month rate of increase nearly doubled to 10.5% versus 4Q. During the last ten years there has been a 59% correlation between the annual change in wholesale inventories less petroleum and the change in merchandise imports.
Business sales rose 1.5% and three month growth was still a firm 9.4% as of January. Much of that strength was due to wholesale sales which grew at a 17.7% rate over the three months. Petroleum industry sales grew at a 76.2% rate but less petroleum wholesale sales still were strong and grew at a 10.7% rate over the last three months.
As of January, strength in sales offset the gain in inventories and the I/S ratio fell to 1.25%, the lowest since 2005.
Inventories, Lumpy Trade, and Large Devaluations from the Federal Reserve Bank of Philadelphia can be found here.
| Business Inventories | January | December | Y/Y | 2007 | 2006 | 2005 |
|---|---|---|---|---|---|---|
| Total | 0.8% | 0.7% | 4.8% | 4.1% | 5.8% | 6.2% |
| Retail | 0.4% | 0.0% | 3.3% | 3.0% | 3.2% | 2.8% |
| Retail excl. Auto | 0.4% | 0.8% | 3.8% | 3.3% | 4.5% | 4.5% |
| Wholesale | 0.8% | 1.1% | 6.4% | 6.1% | 8.5% | 7.4% |
| Manufacturing | 1.3% | 0.9% | 5.0% | 3.7% | 6.4% | 8.9% |
by Tom Moeller March 19, 2008
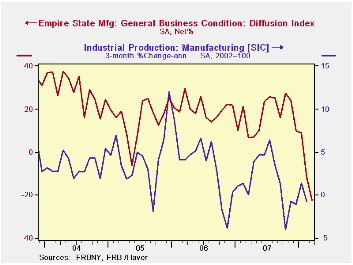
The March index of manufacturing activity in New York State fell to a more negative reading of -22.23 in March after a -11.72 February figure. Expectations were for -6.3. The figures are reported by the Federal Reserve Bank of New York.
Since the series' inception in 2001 there has been a 55% correlation between the index level and the three month change in U.S. factory sector industrial production.
New orders, shipments and inventories were deeply negative.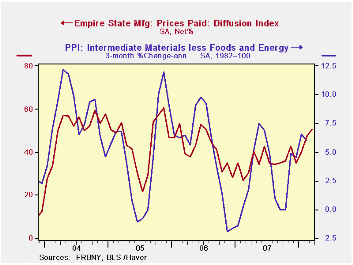
The employment index improved to a positive 4.49 from -2.11 in February. In the (perhaps too) short six year history of the NY employment index, there has been an 85% correlation between it and the three month growth in overall factory sector employment.
Like the Philadelphia Fed Index of General Business Conditions, the Empire State Business Conditions Index reflects answers to an independent survey question; it is not a weighted combination of the components.
Pricing pressure rose to its highest level since June of 2006. Since 2001 there has been an 81% correlation between the index of prices paid and the three month change in the core intermediate materials PPI.
The Empire State index of expected business conditions in six months improved slightly and remained near its lowest in six years.
The Empire State Manufacturing Survey is a monthly survey of manufacturers in New York State conducted by the Federal Reserve Bank of New York. Participants from across the state in a variety of industries respond to a questionnaire and report the change in a variety of indicators from the previous month. Respondents also state the likely direction of these same indicators six months ahead. April 2002 is the first report, although survey data date back to July 2001.
For more on the Empire State Manufacturing Survey, including methodologies and the latest report, click here.
| Empire State Manufacturing Survey | March | February | March '07 | 2007 | 2006 | 2005 |
|---|---|---|---|---|---|---|
| General Business Conditions (diffusion index) | -22.23 | -11.72 | 6.63 | 17.23 | 20.24 | 15.53 |
| Prices Paid | 50.56 | 47.37 | 30.23 | 35.64 | 41.88 | 44.74 |
by Robert Brusca March 19, 2008
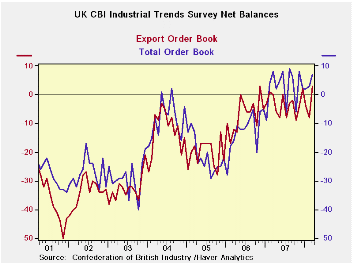
UK order books are high, in the 96th percentile of their range of values since end-2000 in terms of the net balance readings of the CBI survey. Total orders are strong and exports are the highest seen in this seven-plus year period Output volume expected in the next 3-months is more restrained but still resides in the top 18 percent of its range (100-82=18). Stocks of product are mid range, neither too high nor too low. Price expectations will not be good news to the BOE. Prices expected in the next 3-months are the highest net balance we have sense in this period at +25, up sharply from +22 in February and average expectations of +18 over the past year.
In analyzing these trends one thing to consider is the recent choppiness of recent movements. The export order jump month-to-month lifted export orders to the top percentile of the seven plus year range from its top 20th percentile reading last month. Output volume expected jumped from the 70th percentile of the range last month to the 82nd percentile (top 18%). So before we celebrate we need to recognize that the UK industrial sector is doing better, but that the monthly readings are volatile. The one exception might be for expected prices where the monthly gains have been large and steady. It is not clear that the UK industrial sector is as strong as a top of range reading makes it seem. The chart makes it clear that there has been some recovery but that the net positive readings are relatively moderate despite their relative range position that the order readings have posted. For the most part these readings are moving sideways and are not pointing to an acceleration that might signal overheating. Still the price component is a bit unsettling.
| UK Industrial volume data CBI Survey | |||||||||
|---|---|---|---|---|---|---|---|---|---|
| Reported: | Mar-08 | Feb-08 | Jan-08 | Dec-07 | 12Mo Avg | Pcntle | Max | Min | Range |
| Total Orders | 7 | 3 | 2 | 2 | 3 | 96% | 9 | -40 | 49 |
| Export Orders | 3 | -8 | -4 | 2 | -4 | 100% | 3 | -50 | 53 |
| Stocks: Final Goods | 12 | 11 | 7 | 14 | 10 | 50% | 26 | -2 | 28 |
| Output Volume: Next 3-months | 11 | 11 | 9 | 3 | 13 | 70% | 28 | -28 | 56 |
| Avg Prices 4 Next 3-months | 25 | 22 | 21 | 15 | 18 | 100% | 25 | -30 | 55 |
| From end 2000 | |||||||||
by Robert Brusca March 19, 2008
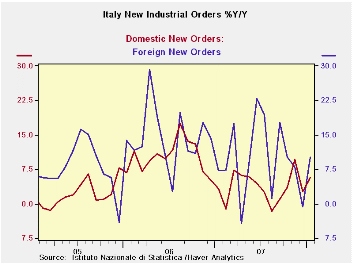 Italy’s orders jumped
sharply in January but only after an
even larger fall in December. As a result the Q1 sales growth for
orders in January over the Q4 average is a dismal -1.8%. Foreign orders
in Q1 2008 are still rising however at a 4.4% rate but domestic orders
are a very weak -5.4%.
Italy’s orders jumped
sharply in January but only after an
even larger fall in December. As a result the Q1 sales growth for
orders in January over the Q4 average is a dismal -1.8%. Foreign orders
in Q1 2008 are still rising however at a 4.4% rate but domestic orders
are a very weak -5.4%.
Italian sales are however up sharply higher in 2008-Q1: as of January. Sales are growing at a strong 18% pace in the quarter with 3.6% growth over three months and 5.7% growth over 12 months. So order weakness has yet to hit the sales bottom line. Still, order and sales in Italy have tracked closely in the past, so the weakness in orders should be ignored.
| Italy Orders | ||||||
|---|---|---|---|---|---|---|
| Saar exept m/m | Jan-08 | Dec-07 | Nov-07 | 3-mo | 6-mo | 12-mo |
| Total | 2.6% | -5.6% | 2.9% | -1.0% | -3.0% | 7.2% |
| Foreign | 5.3% | -8.1% | 3.9% | 2.0% | -8.3% | 10.0% |
| Domestic | 1.1% | -4.1% | 2.4% | -2.8% | -0.2% | 5.7% |
| Memo | ||||||
| Sales | 4.6% | -2.6% | 0.2% | 9.0% | 3.6% | 5.7% |
by Robert Brusca March 19, 2008
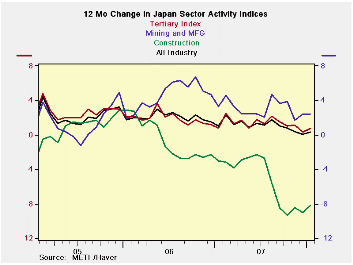
Japan’s all-industry index was flat in January. The tertiary index that it tracks so closely was up to 110.3 from 109.5 in December. In terms of year-to-year changes the tertiary and all-industries indices are about the same showing a small bounce in the recent month but holding in a shallow downtrend overall. Mining and MFG are well off peak and the sector moved lower in January to 109.5 from 112.0 in December. This left the year/year change in the index near zero. Over the past several months Japan’s sector indices have more or less held steady in terms of their year/year changes. Even the very weak construction index that fell again in January is steady to a bit higher over 12 months.
Amid these signals the Japanese government has downgraded its assessment of the economy for the second consecutive month in March.The Cabinet Office that issues the assessment cited stalled corporate capital spending and weak industrial production. Private consumption has lagged for time and was also on the laundry list of reason to downgrade the economy. The government said in its March report that "the economic recovery appears to be pausing recently." This pronouncement is a bold contrast to its overview in the February report that held: "the economy is recovering at a moderate pace recently." Things change.
This is the ‘first second’ for a downgrade: It is the first
time in this cycle that the government has downgraded its overall
assessment of the economy for the second month in a row. Last time it
did such a thing was in November and December 2004.
The first downgrade in this cycle came in February a
period that is not yet covered in the data table below.
In February the government lowered its assessment of the
economy due to slower growth of exports and industrial production in
addition to continuing weakness in private consumption and housing
construction. This month’s downgrade features some of the same sectors:
capital investment, industrial output and private consumer spending.
Japan once again has issues. With the yen now rising, Japan faces
challenges and still needs a head at its central bank. …and it’s not a
good time to be without monetary leadership.
| Up to date Japan Industry Surveys | |||||||||
|---|---|---|---|---|---|---|---|---|---|
| Recent Months | Moving Averages | Extremes; Range | |||||||
| Jan 2008 |
Dec 2007 |
Nov 2007 |
3Mo | 6Mo | 12Mo | Max | Min | %-Tile | |
| All Industry | 107.0 | 107.0 | 107.4 | 107.1 | 107.4 | 107.3 | 108.4 | 93.6 | 90.5% |
| Construction | 71.5 | 72.0 | 72.1 | 71.9 | 72.3 | 76.3 | 124.6 | 71.1 | 0.7% |
| Mining and MFG | 109.5 | 112.0 | 110.4 | 110.6 | 111.1 | 109.4 | 112.2 | 87.7 | 89.0% |
| Tertiary | 110.3 | 109.5 | 110.5 | 110.1 | 110.2 | 110.1 | 111.2 | 91.0 | 95.5% |
| Ranges, Max, Min since 1993 | |||||||||

Tom Moeller
AuthorMore in Author Profile »Prior to joining Haver Analytics in 2000, Mr. Moeller worked as the Economist at Chancellor Capital Management from 1985 to 1999. There, he developed comprehensive economic forecasts and interpreted economic data for equity and fixed income portfolio managers. Also at Chancellor, Mr. Moeller worked as an equity analyst and was responsible for researching and rating companies in the economically sensitive automobile and housing industries for investment in Chancellor’s equity portfolio. Prior to joining Chancellor, Mr. Moeller was an Economist at Citibank from 1979 to 1984. He also analyzed pricing behavior in the metals industry for the Council on Wage and Price Stability in Washington, D.C. In 1999, Mr. Moeller received the award for most accurate forecast from the Forecasters' Club of New York. From 1990 to 1992 he was President of the New York Association for Business Economists. Mr. Moeller earned an M.B.A. in Finance from Fordham University, where he graduated in 1987. He holds a Bachelor of Arts in Economics from George Washington University.
More Economy in Brief


