 Global| Nov 16 2007
U.S. Business Inventories' Increase Moderate
by:Tom Moeller
|in:Economy in Brief
Summary
Total business inventories rose a moderate 0.4% during September following the prior month's 0.3% gain. The three month change in inventories remained stable with the prior few months, up from earlier this year but half the growth [...]
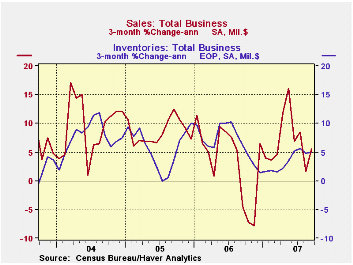
Total business inventories rose a moderate 0.4% during September
following the prior month's 0.3% gain. The three month change in
inventories remained stable with the prior few months, up from earlier
this year but half the growth rates seen last year. That slowing
remained a function of the slower growth in sales
Retail inventories ticked up just 0.1%. Inventories of motor
vehicles & parts dealers actually fell a slight 0.1% (+2.1% y/y)
after the 1.5% spurt during August. Excluding autos, retail inventories
rose a modest 0.2% following a little revised, negligible August
decline. Furniture inventories spurted 1.3% (3.3% y/y) and the three
month change rose to an excessive (9.9%, AR). At clothing &
accessory stores inventories rose 0.1% and offset a 0.1% August
downtick and it left the three month at a manageable 0.0%. Inventories
at General merchandise stores also seemed under control. a 0.4% gain
followed declines during the prior three months and three month growth
was a negative 2.8%.
Wholesale inventories rose 0.8% following a very much upwardly revised 0.7% August increase. Petroleum inventories fell for third straight month (-1.3% y/y) and less petroleum, wholesale inventories rose 0.9%, up 5.4% y/y which is a y/y growth rate which has halved versus late last year. During the last ten years there has been a 59% correlation between the annual change in wholesale inventories les petroleum and the change in merchandise imports.
Factory inventories rose 0.6% (2.2% y/y) after two months of little change. Three month growth in manufacturers' inventories was 2.3% versus a 6.4% rate of growth during all of last year.
The Role of Money in Monetary Policy: Why Do the Fed and ECB See It So Differently? from the Federal Reserve Bank of Kansas City can be found here.
| Business Inventories | September | August | Y/Y | 2006 | 2005 | 2004 |
|---|---|---|---|---|---|---|
| Total | 0.4% | 0.3% | 3.3% | 5.9% | 6.2% | 7.9% |
| Retail | 0.1% | 0.5% | 2.8% | 3.2% | 2.8% | 6.8% |
| Retail excl. Autos | 0.2% | -0.0% | 3.2% | 4.5% | 4.5% | 7.2% |
| Wholesale | 0.8% | 0.7% | 5.2% | 8.6% | 7.4% | 9.7% |
| Manufacturing | 0.6% | -0.1% | 2.2% | 6.4% | 8.9% | 7.7% |

Tom Moeller
AuthorMore in Author Profile »Prior to joining Haver Analytics in 2000, Mr. Moeller worked as the Economist at Chancellor Capital Management from 1985 to 1999. There, he developed comprehensive economic forecasts and interpreted economic data for equity and fixed income portfolio managers. Also at Chancellor, Mr. Moeller worked as an equity analyst and was responsible for researching and rating companies in the economically sensitive automobile and housing industries for investment in Chancellor’s equity portfolio. Prior to joining Chancellor, Mr. Moeller was an Economist at Citibank from 1979 to 1984. He also analyzed pricing behavior in the metals industry for the Council on Wage and Price Stability in Washington, D.C. In 1999, Mr. Moeller received the award for most accurate forecast from the Forecasters' Club of New York. From 1990 to 1992 he was President of the New York Association for Business Economists. Mr. Moeller earned an M.B.A. in Finance from Fordham University, where he graduated in 1987. He holds a Bachelor of Arts in Economics from George Washington University.
More Economy in Brief


