 Global| Feb 13 2006
U.S. Budget Surplus Up Due to Strong Receipts
by:Tom Moeller
|in:Economy in Brief
Summary
The U.S. federal government posted a wider budget surplus during January as net revenues held on to a strong increase during December. The surplus, common during past Januarys, nearly doubled y/y to $21.0B. The fiscal year to date [...]
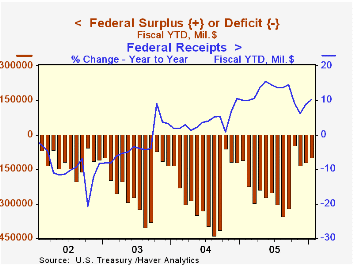
The U.S. federal government posted a wider budget surplus during January as net revenues held on to a strong increase during December. The surplus, common during past Januarys, nearly doubled y/y to $21.0B. The fiscal year to date budget deficit shrunk as a result to $98.3B from $109.5B during the first four months of FY05.
Net revenues did fall 4.9% during January but the decline barely dented a 74.4% December surge. Individual income tax receipts (44% of total receipts) jumped 36.4% (19.2% y/y) during January following a two thirds increase during December. That made up for a m/m drop in corporate income taxes (10% of total receipts) which remained up 40.2% y/y.
The improved job market raised employment taxes (36% of total receipts) 6.3% y/y.
U.S. net outlays fell 9.5% m/m during January but fiscal year to date outlays rose 7.5% y/y. Defense (19% of total outlays) for the first four months of FY06 were up 8.2% from the year prior. Medicare spending (12% of total outlays) rose 5.9% y/y and spending on social security (21% of total outlays) rose 5.7%. Spending on health programs (10% of the total) rose 3.0% while spending on education & training (4% of the total) fell 3.3% y/y. Interest expense (8% of the total) grew 22.4% with higher interest rates.
The latest projections from the US Congressional Budget Office are available here.
| US Government Finance | Jan | Dec | Y/Y | FY 2005 | FY 2004 | FY 2003 |
|---|---|---|---|---|---|---|
| Budget Balance | $21.0B | $11.0B | $8.6B (1/05) | $-318.3B | $-412.7B | $-377.6B |
| Net Revenues | $230.0B | $241.9B | 13.7% | 14.5% | 5.5% | -3.8% |
| Net Outlays | $209.0B | $230.9B | 7.9% | 7.8% | 6.2% | 7.4% |
by Tom Moeller February 13, 2006
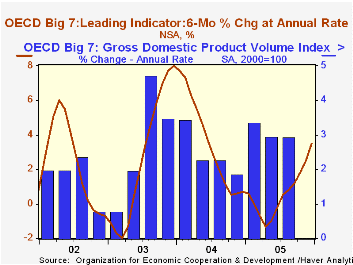
During December, the Leading Index of the Major 7 OECD economies capped a year of slower growth for the full year of 2005, but improvement in the second half. In fact, a 0.6% December rise pulled the average monthly gain during 2H '05 to 0.4%, the best since early 2004, and lifted the leaders' six month annual growth rate to 3.5%.
During the last ten years there has been a 66% correlation between the change in the leading index and the q/q change in the GDP Volume Index for the Big Seven countries in the OECD.
Japan's leading index showed marked improvement as the year progressed and logged a 0.5% increase in December, the strongest since in over two years. It raised the six month growth rate to 2.4% though earlier growth rates were revised lower. The leaders' correlation with real economic growth in Japan has been a meaningful 40% during the last ten years.
The U.S. leaders posted a 0.9% rise during December that was the firmest since late 2003. It raised the leaders' six month growth to 4.3%, up sharply from the negative growth rates logged early in 2005. The correlation between the leaders' growth rate and real GDP growth has been a high 73% during the last ten years.
Leaders in the European Union (15 countries) continued on the moderate growth path in place since June and rose 0.3%. The rise raised the six month growth rate to 3.4%, the best since June '04. During the last ten years there has been a 59% correlation between the change in the leading index and the quarterly change in the GDP volume index for the European Union.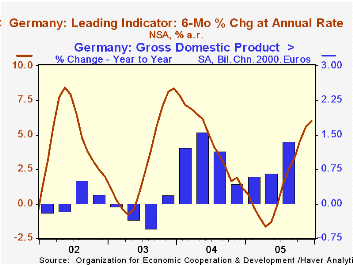
TheGerman leading index increased 0.5% for the eighth consecutive monthly increase. As a result the six month growth rate increased to 6.0%, the best since early 2004.
The 0.3% December gains in the French leaders was the slowest since June but the six month growth rate nevertheless rose to 4.4%, the best since mid-2004. To the downside, the Italian leading index fell for the third straight month and the 0.1% decline lowered the six month growth to a negative 1.3%.
The UK leaders were unchanged for the second month but the six month growth rate picked up to a positive 0.4%, off the negative lows of early 2005.
The Canadian leaders improved sharply for the second month with a 1.5% increase that followed an upwardly revised 0.9% spurt during November. The six month growth jumped, as a result, to 4.2%, its most promising since early 2004 The correlation of the leaders' growth with Canadian real GDP has been 49% during the last ten years.
The latest OECD Leading Indicator report is available here.
| OECD | Dec | Nov | Y/Y | 2005 | 2004 | 2003 |
|---|---|---|---|---|---|---|
| Composite Leading Index | 104.53 | 103.89 | 1.8% | 102.77 | 102.37 | 97.87 |
| 6 Month Growth Rate | 3.5% | 2.5% | 0.6% | 3.5% | 2.7% |
by Louise Curley February 13, 2006
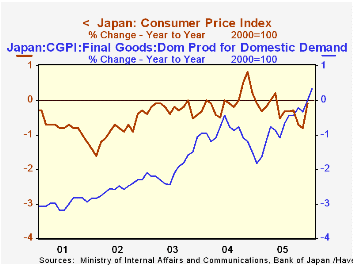
Japan's corporations raised the average selling price of domestic goods 0.3% in January over January 2005. This was the first year-to-year increase since early 1998. The ability to raise prices, however small, was a welcome sign that the long deflation may be coming to an end. The relationship between the domestic corporate good price index and the consumer price index is loose but logic suggests that a rise in the corporate price of goods will eventually be reflected in the consumer price level. The first chart shows the year-to-year changes in the domestic corporate goods price index for final goods and in the consumer price index.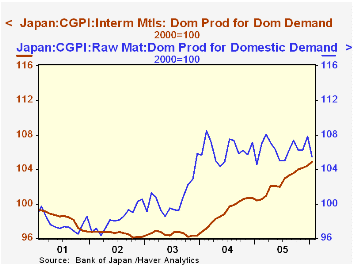
Prices of raw materials rose sharply in late 2003 and have remained relatively steady since then. Intermediate materials have continued to rise steadily and are now at the highest levels since the early 90's. The levels of these indexes are shown in chart two. In spite of the pressure of rising costs, corporations have been unable to raise final prices until this January. The prices of final goods, showed a very slight upward trend in 2005, but for the year as a whole, final prices averaged 91 or 9% below the level of 2000.
The Corporate Goods Price Index (CPGI) measures the prices of goods traded among companies. It is designed to show price developments that reflect supply and demand conditions.
| Japan: Corporate Prices and Consumer Price Index) | Jan 06 | Dec 05 | Jan 05 | M/M % | Y/Y % | 2005 | 2004 | 2003 |
|---|---|---|---|---|---|---|---|---|
| Corporate Goods Price Index (CGPI) (2000=100) | 102.8 | 102.7 | 97.0 | -0.29 | 5.57 | 100.1 | 97.1 | 96.0 |
| Domestic Corporate Goods Price Index (DCGPI) | 99.0 | 98.8 | 96.4 | 0.20 | 2.70 | 97.7 | 96.1 | 94.9 |
| Raw materials | 105.5 | 107.8 | 104.6 | -2.13 | 0.86 | 105.4 | 106.3 | 100.7 |
| Intermediate materials | 104.9 | 104.4 | 100.4 | 0.48 | 4.48 | 102.5 | 99.1 | 96.5 |
| Final goods | 91.0 | 91.1 | 90.7 | -0.11 | 0.33 | 91.0 | 91.8 | 92.6 |
| Year-to-year Change % | Jan 06 | Dec 05 | Nov 05 | Oct 05 | Sep | 2005 | 2004 | 2003 |
| Consumer Price Index | n.a. | -0.10 | -0.81 | -0.71 | -0.31 | 97.8 | 98.1 | 99.1 |
| Final goods | 0.33 | 0.00 | -0.33 | -0.22 | -0.44 | 91.0 | 91.8 | 92.6 |
Tom Moeller
AuthorMore in Author Profile »Prior to joining Haver Analytics in 2000, Mr. Moeller worked as the Economist at Chancellor Capital Management from 1985 to 1999. There, he developed comprehensive economic forecasts and interpreted economic data for equity and fixed income portfolio managers. Also at Chancellor, Mr. Moeller worked as an equity analyst and was responsible for researching and rating companies in the economically sensitive automobile and housing industries for investment in Chancellor’s equity portfolio. Prior to joining Chancellor, Mr. Moeller was an Economist at Citibank from 1979 to 1984. He also analyzed pricing behavior in the metals industry for the Council on Wage and Price Stability in Washington, D.C. In 1999, Mr. Moeller received the award for most accurate forecast from the Forecasters' Club of New York. From 1990 to 1992 he was President of the New York Association for Business Economists. Mr. Moeller earned an M.B.A. in Finance from Fordham University, where he graduated in 1987. He holds a Bachelor of Arts in Economics from George Washington University.
More Economy in Brief
 Global| Feb 05 2026
Charts of the Week: Balanced Policy, Resilient Data and AI Narratives
by:Andrew Cates


