 Global| Jun 10 2004
U.S. Budget Deficit Shrunk
by:Tom Moeller
|in:Economy in Brief
Summary
The U.S. Government Budget deficit shrunk to $62.5B in May versus a deficit of $88.9B in May '03. The improvement was slightly greater than expected by the Consensus. For the first eight months of FY04 the deficit of $344.3 was 18.4% [...]
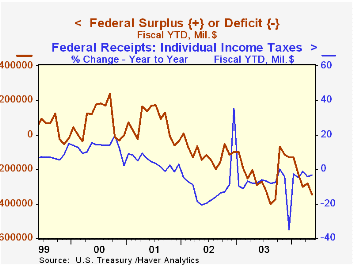
The U.S. Government Budget deficit shrunk to $62.5B in May versus a deficit of $88.9B in May '03. The improvement was slightly greater than expected by the Consensus. For the first eight months of FY04 the deficit of $344.3 was 18.4% larger than last year.
Growth in net receipts for the first eight months of FY04 improved to 2.3% versus the first eight months of FY03. The rise from 1.3% growth last month reflected strong individual tax receipts, up 27.5% versus last May. That pulled fiscal YTD growth in individual tax receipts to -3.1% versus last year and compared to a 7.5% decline n FY03.
Corporate tax receipts continued to surge and for the fiscal year-to-date were up 46.6% ($96.0B) versus last fiscal YTD. Growth in contributions for social insurance contributions (FICA) improved to 2.5% with the rise in employment.
Growth in Federal net expenditures eased to 5.5% versus the first eight months of last fiscal year. Defense expenditures growth slowed to 12.5% from 16.7% in April. Growth in Medicare outlays slumped to 3.9% from 8.9% but interest expense fell only 0.7% versus a 3.8% y/y decline in April.
"Deficit-Financed Tax Cuts and Interest Rates" from the Federal Reserve Bank of Philadelphia is available here.
| US Government Finance | May | April | May '03 | FY2003 | FY2002 | FY2001 |
|---|---|---|---|---|---|---|
| Budget Balance | $-62.5B | $17.6B | $-88.9B | $-374.2B | $-157.8B | $127.3B |
| Revenues | $115.5B | $220.1B | 11.6% | -3.8% | -6.9% | -1.7% |
| Outlays | $177.9B | $202.5B | -7.5% | 7.2% | 7.9% | 4.2% |
by Tom Moeller June 10, 2004
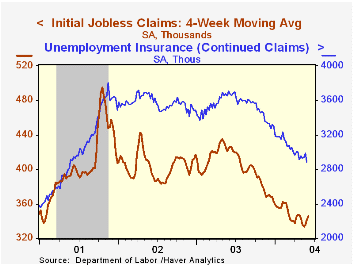
Initial claims for jobless insurance rose 12,000 last week to 352,000 following two weeks of decline. Consensus expectations had been for 335,000 claims.
The 4-week moving average of initial claims rose to 346,000 (-18.7% y/y), the highest level since late April.
Continuing claims for unemployment insurance fell 106,000 to the lowest level since May 2001.
The insured rate of unemployment fell back to 2.3%.
"A Jobless Recovery With More People Working?" from the Federal Reserve Bank of St. Louis can be found here.
| Unemployment Insurance (000s) | 6/05/04 | 5/29/04 | Y/Y | 2003 | 2002 | 2001 |
|---|---|---|---|---|---|---|
| Initial Claims | 352 | 340 | -17.0% | 403 | 404 | 406 |
| Continuing Claims | -- | 2,881 | -22.3% | 3,533 | 3,573 | 3,023 |
by Tom Moeller June 10, 2004
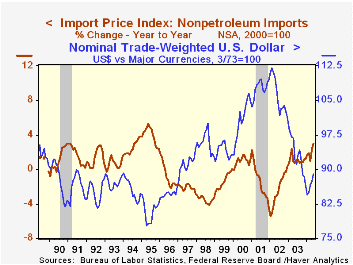
Import prices jumped 1.6% last month led by a 5.6% surge in industrial materials prices. The rise pulled the y/y gain in import prices to 7.0%, the fastest rate of increase since early last year.
The recent rise in import prices has been accompanied by a 20% decline in the trade weighted value of the dollar against major currencies since early 2002. During the last fifteen years there has been a (negative) 60% correlation between this value of the dollar and the y/y change in nonoil import prices.
Higher oil prices accounted for much of the gain in overall import prices. The 10.3% May increase in petroleum prices has been followed this month by a decline in the price of Brent crude to $34.74 yesterday from an average $37.50 last month.
Nonpetroleum import prices also rose a strong 0.4% (3.0% y/y) in May but the rise largely reflected a 2.1% (14.7% y/y) gain in nonoil industrial supplies such as iron & steel, lumber and natural gas.
Capital goods prices ticked up 0.1% (-1.0% y/y) following a 0.5% April decline. Computer & peripheral prices rose 0.1% (-5.0% y/y). Capital goods prices excluding computers also rose 0.1% (+1.2% y/y). Non-auto consumer goods prices fell 0.1% (0.6% y/y) for the second month. Motor vehicle & parts prices were unchanged (+1.3% y/y). Prices for imported foods, feeds & beverages fell 0.3% (+5.5% y/y), the first monthly decline since last August.
Export prices gained 0.3% led by a 0.5% rise in agricultural export prices (20.9% y/y). Nonagricultural export prices rose 0.2% (2.8% y/y).
| Import/Export Prices (NSA) | May | April | Y/Y | 2003 | 2002 | 2001 |
|---|---|---|---|---|---|---|
| Import - All Commodities | 1.6% | 0.2% | 7.0% | 2.9% | -2.5% | -3.5% |
| Petroleum | 10.3% | -0.4% | 43.9% | 21.0% | 3.0% | -17.2% |
| Non-petroleum | 0.4% | 0.3% | 3.0% | 1.1% | -2.4% | -1.5% |
| Export - All Commodities | 0.3% | 0.7% | 4.3% | 1.6% | -1.0% | -0.8% |

Tom Moeller
AuthorMore in Author Profile »Prior to joining Haver Analytics in 2000, Mr. Moeller worked as the Economist at Chancellor Capital Management from 1985 to 1999. There, he developed comprehensive economic forecasts and interpreted economic data for equity and fixed income portfolio managers. Also at Chancellor, Mr. Moeller worked as an equity analyst and was responsible for researching and rating companies in the economically sensitive automobile and housing industries for investment in Chancellor’s equity portfolio. Prior to joining Chancellor, Mr. Moeller was an Economist at Citibank from 1979 to 1984. He also analyzed pricing behavior in the metals industry for the Council on Wage and Price Stability in Washington, D.C. In 1999, Mr. Moeller received the award for most accurate forecast from the Forecasters' Club of New York. From 1990 to 1992 he was President of the New York Association for Business Economists. Mr. Moeller earned an M.B.A. in Finance from Fordham University, where he graduated in 1987. He holds a Bachelor of Arts in Economics from George Washington University.
More Economy in Brief


