 Global| Jun 23 2008
U.S. Bankruptcies Surge and the 2005 Procedure
by:Tom Moeller
|in:Economy in Brief
Summary
In the wake of legislation passed in October, 2005 the rules governing the filing for bankruptcy in the United States changed dramatically. Late that year, the number of bankruptcies surged five-fold from the earlier level. The data [...]
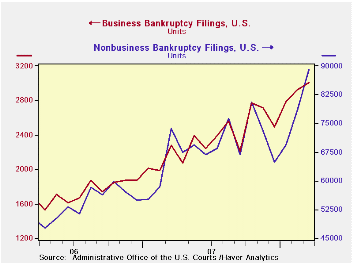
In the wake of legislation passed in October, 2005 the rules governing the filing for bankruptcy in the United States changed dramatically. Late that year, the number of bankruptcies surged five-fold from the earlier level. The data behind these filings can be found in Haver's REGIONAL database.
Before the institution of the new procedures there was roughly a 60% correlation between personal income growth and bankruptcy filings. Corporate profit growth and non-personal bankruptcies also had roughly a 60% correlation.
Economic growth, at the time of the new rules' institution, was running at roughly a 3% real rate. On the income side of the National Income Account ledger, real disposable personal income growth was growing at nearly at a 4% rate while corporate profits were growing 12%.
The earlier procedure, for bankruptcy filing can be found here.
The situation changed dramatically in 2005 and bankruptcy filings surged five-fold. An outline of the new rules can be found here.
Since 2005, the level of total bankruptcies, business & non-business has jumped. The level of business bankruptcies has nearly doubled and personal bankruptcies also has nearly doubled. And the correlation between income and profits now is negligible.
Real disposable income growth has run at a 3% rate while profit growth ran between 3% and 12% since 2005.
The Economic Logic of a Fresh Start from the Federal Reserve Bank of Philadelphia is available here.
Testimony by Fed Vice Chairman Donald L. Cohn, Risk Management and Its Implications for Systemic Risk, can be found here.
Chicago Fed Index Still Gives A Recession Signalby Tom Moeller June 23, 2008
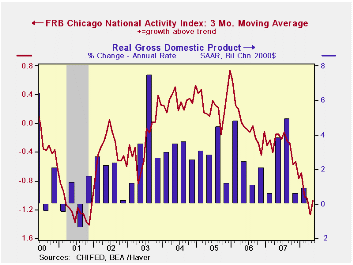
The Chicago Fed National Activity Index (CFNAI), published by the Chicago Federal Reserve Bank, for May remained negative at -0.96. The reading left the three-month moving average of the figure to -1.08 which was near its lowest level since the end of the 2001 recession.
A zero value of the CFNAI indicates that the economy is expanding at its historical trend rate of growth of roughly 3%. During the last twenty years there has been a 68% correlation between the level of the CFNAI and q/q growth in real GDP. An index level at or below -0.70 typically has indicated negative U.S. economic growth.
The complete CFNAI report is available here and the historical data are available in Haver's SURVEYS database.
The modest improvement in May owed to production-related indicators. Employment, consumption and housing continued to make negative contributions to the CFNAI during April.
The CFNAI is a weighted average of 85 indicators of economic activity. The indicators reflect activity in the following categories: production & income, the labor market, personal consumption & housing, manufacturing & trade sales, and inventories & orders.
Economic Trends and the Chicago Fed National Activity Index from the Federal Reserve Bank of Chicago is available here.
| Chicago Fed | May | April | May '07 | 2007 | 2006 | 2005 |
|---|---|---|---|---|---|---|
| CFNAI | -0.96 | -1.23 | -0.29 | -0.42 | -0.05 | 0.26 |
| 3-Month Average | -1.08 | -1.27 | -0.15 |
by Louise Curley June 23, 2008
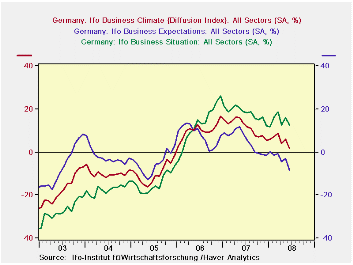
Business confidence, as measured by the IFO Business Climate Indicator, continued to weaken in June. The percent balance indicator fell to 1.7% from 6.1% in May. This was the lowest value since January 2006. The 7000 business executives in manufacturing, construction, wholesale and retail trade who participate in the survey, lowered their appraisals of both their current conditions and their outlook for the next six months. The percent balance between the optimists and the pessimists regarding their current condition fell to 12.4% in June from 15.9% in May while the percent balance of the pessimists over the optimists regarding the outlook six months ahead rose to 8.4% in June from 3.2% in May. The trends in the overall measure and its components--current conditions and the six month's outlook--are shown in the first chart.
Earlier the rise in the euro with its negative impact on exports and the slowdown in the U. S. economy accounted for some of the earlier loss in confidence, but now the recent sharp rises in oil and food prices increase the possibility or an interest rate rise by the European Central Bank.
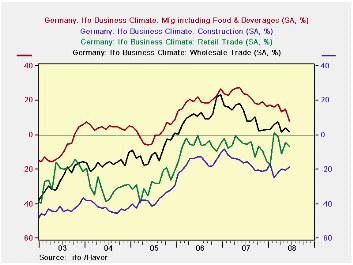
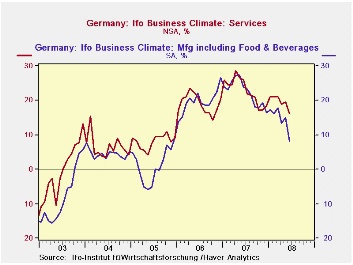
Confidence, as measured by the business climate, declined in manufacturing, wholesale and retail trade, but became slightly less pessimistic in construction as shown in the second chart.
The IFO has published confidence measures for the service sector since May, 2001. (The industry sector measures go back to 1991.) These data are based on the opinions of 2000 executives and are not, as yet, seasonally adjusted. Despite the difference between seasonally adjusted and non seasonally adjusted data, the comparison between confidence in the manufacturing industry and the services, suggests that confidence in the services tends to be higher and less volatile than that in manufacturing as shown in the third chart.
| GERMAN
BUSINESS CONFIDENCE IFO (SA ex where noted) (% balance) |
Jun 08 | May 08 | Jun 07 | M/M Chg | Y/Y Chg | 2007 | 2006 | 2005 |
|---|---|---|---|---|---|---|---|---|
| Business Climate | 1.7 | 6.1 | 13.2 | -4.4 | -11.5 | 11.3 | 10.1 | -9.7 |
| Current Conditions | 12.4 | 15.9 | 18.5 | -3.5 | -6.1 | 18.1 | 12.6 | -14.2 |
| Outlook, Six Months Ahead | -8.4 | -3.2 | 8.1 | -5.2 | -16.5 | 5.1 | 7.8 | -5.1 |
| Manufacturing Climate | 8.2 | 15.0 | 24.0 | -6.8 | -15.8 | 22.3 | 19.7 | 1.2 |
| Construction Climate | -18.9 | -20.2 | -16.2 | 1.3 | -2.7 | -16.2 | -15.8 | -37.1 |
| Retail Trade Climate | -6.5 | -4.4 | -5.1 | -2.1 | -1.4 | -6.5 | -6.1 | -28.0 |
| Wholesale Trade Climate | 2.1 | 4.0 | 14.1 | -1.9 | -12.0 | 11.0 | 11.6 | -9.8 |
| Services (NAS) | 16.3 | 19.4 | 26.0 | -3.1 | -9.7 | 22.8 | 19.1 | 8.1 |
by Robert Brusca June 23, 2008
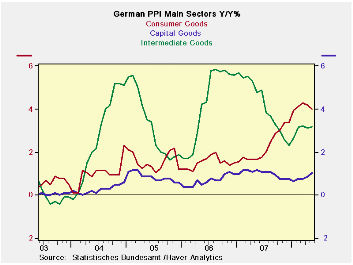
Price trends deteriorate
Manufacturing prices were up strongly in May. All major divisions of
the PPI are showing some pressure even capital goods inflation is
rising. Core PPI prices are up by 2.9% Yr/Yr and at a faster paced 3.6%
over three-and six-months.
Inflation accelerates
At least the acceleration in consumer prices where inflation has been
the virulent has begun to slow. Yet, over the past year the Yr/Yr
inflation rate has accelerated by four percentage points while Core PPI
inflation has accelerated by 0.3 percentage points.
Why it matters…
While the ECB’s inflation ceiling applies to HICP prices only, the
worry from the ECB’s standpoint is that producer price inflation could
become embedded in prices at the consumer level.
| Germany PPI | ||||||||
|---|---|---|---|---|---|---|---|---|
| %m/m | %-SAAR | |||||||
| May-08 | Apr-08 | Mar-08 | 3-mo | 6-mo | 12-mo | 12-moY-Ago | IN Q1 | |
| MFG | 1.1% | 0.9% | 0.5% | 10.5% | 7.7% | 5.9% | 1.9% | 8.3% |
| Ex Energy | 0.4% | 0.2% | 0.4% | 3.6% | 3.6% | 2.9% | 2.6% | 4.1% |

Tom Moeller
AuthorMore in Author Profile »Prior to joining Haver Analytics in 2000, Mr. Moeller worked as the Economist at Chancellor Capital Management from 1985 to 1999. There, he developed comprehensive economic forecasts and interpreted economic data for equity and fixed income portfolio managers. Also at Chancellor, Mr. Moeller worked as an equity analyst and was responsible for researching and rating companies in the economically sensitive automobile and housing industries for investment in Chancellor’s equity portfolio. Prior to joining Chancellor, Mr. Moeller was an Economist at Citibank from 1979 to 1984. He also analyzed pricing behavior in the metals industry for the Council on Wage and Price Stability in Washington, D.C. In 1999, Mr. Moeller received the award for most accurate forecast from the Forecasters' Club of New York. From 1990 to 1992 he was President of the New York Association for Business Economists. Mr. Moeller earned an M.B.A. in Finance from Fordham University, where he graduated in 1987. He holds a Bachelor of Arts in Economics from George Washington University.
More Economy in Brief


