 Global| May 12 2008
U.S. April Budget Surplus Down, 2008 FYTD Deficit Nearly Doubled
by:Tom Moeller
|in:Economy in Brief
Summary
As it usually does in April, the U.S. government ran a budget surplus of $159.3B. The figure was down slightly, however, from last year's unusually large April surplus of $177.7B. Based on expectations formed by Public Debt [...]
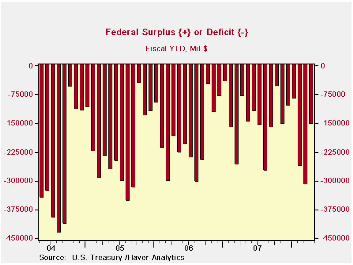
As it usually does in April, the U.S. government ran a budget surplus of $159.3B. The figure was down slightly, however, from last year's unusually large April surplus of $177.7B. Based on expectations formed by Public Debt Transactions from the Daily Treasury Statement, the budget surplus equaled the Consensus forecast. These Transactions data are available in Haver's DAILY database.
For the first seven months of FY08 the government ran a budget
deficit of $152.2B; nearly double the deficit of $80.8B during the
first seven months of FY07.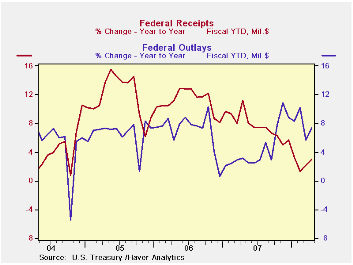
For the fiscal year to date, federal receipts grew a paltry 3.0% from a year earlier. That compared to 11.2% y/y growth during the first seven months of FY07. Higher unemployment constrained the growth in individual income tax receipts (44% of total receipts) to 6.0% this year. Seventeen percent y/y growth had been logged during the first seven months of FY07. Growth in withheld income taxes of 5.6% was roughly half that of a year earlier and non-withheld taxes grew 7.3%, or roughly one quarter as during the first seven months of FY07.
Lower corporate profitability continued to crimp government revenues. Corporate income taxes (13% of total receipts) amounted to $207.0B, a 6.0% decline from receipts during the first seven months of FY07. During FY07 they rose 13.4% during the first seven months.
Unemployment insurance contributions fell 2.7% FYTD due to negative employment growth and Federal excise taxes fell 1.1%.
U.S. net outlays grew 7.4% during the first seven months of FY08, more than double the outlay growth of FY07's first seven months. Growth in defense spending (19% of total outlays) also nearly doubled to a 10.6% growth rate but Medicare expenditures (12% of outlays) grew a much slower 2.1%. Growth in Social Security spending (21% of outlays) held about steady at 5.4% and interest expense grew 8.6%, held back by the recent decline in interest rates. Growth in outlays for income security (15% of outlays) held steady at 15.1% and health spending (10% of the total) grew 5.7%.
The Government's financial data is available in Haver's USECON database.
How Do EITC Recipients Spend Their Refunds? from the Federal Reserve Bank of Chicago can be found here.
Financial Market Tremors: Causes and Responses is from Dallas Federal Reserve Bank President Richard W. Fisher and it is available here.
| US Government Finance | April | March | Y/Y | FY 2007 | FY 2006 | FY 2005 |
|---|---|---|---|---|---|---|
| Budget Balance | -$48.1B | -$175.6B | -$96.3B (3/07) | -$162.0B | -$248.2B | -$318.7B |
| Net Revenues | $178.9 | $105.7B | 7.4% | 6.7% | 11.8% | 14.1% |
| Net Outlays | $227.0 | $281.3B | -13.4% | 2.8% | 7.4% | 7.6% |
by Robert Brusca May 12, 2008
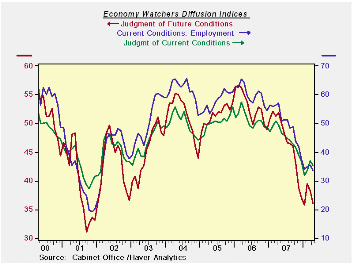
After several months of firming on its various gauges the economy watchers index has dropped again in April. The drop takes the overall index to the bottom several percentile of its five year range and levels employment is the bottom 2.8 percentile of its range. The future index, also lower in the month, resides in the bottom 17 percentile of its range. Similarly in April we have seen the NTC MFG index weaken and the Teikoku indices weaken. The perception that the economy is losing steam in the economy watchers survey seems to on target. Unfortunately the future index is still falling sharply.
| Key Japanese surveys | |||||||
|---|---|---|---|---|---|---|---|
| Raw readings of each survey | Percent of 5-Yr range* | ||||||
| Apr-08 | Mar-08 | Feb-08 | Jan-08 | Apr-08 | Mar-08 | Feb-08 | |
| Diffusion | |||||||
| Economy Watchers | 35.5 | 36.9 | 33.6 | 31.8 | 14.5% | 20.0% | 7.1% |
| Employment | 33.6 | 35.5 | 35.0 | 34.1 | 0.0% | 4.4% | 2.8% |
| Future | 36.1 | 38.2 | 39.5 | 35.8 | 1.4% | 11.5% | 17.8% |
| NTC MFG | 48.6 | 49.5 | 50.8 | 52.4 | 0.0% | 6.0% | 30.5% |
| Econ Trends (Teikoku'/50 neutral/weighted diffusion) | |||||||
| MFG | 36.9 | 37.8 | 38.5 | 37.9 | 0.0% | 0.0% | 4.4% |
| Retail | 32.1 | 33.2 | 32.6 | 31.3 | 5.9% | 13.6% | 9.4% |
| Wholesale | 34.5 | 34.9 | 35.3 | 34.5 | 0.3% | 3.6% | 6.3% |
| Services | 40.4 | 40.5 | 41.0 | 40.4 | 0.0% | 1.1% | 5.4% |
| Construction | 28.0 | 29.3 | 29.7 | 28.9 | 0.0% | 4.3% | 7.5% |
| 100 is high; Zero is low | |||||||
by Robert Brusca May 12, 2008

The quarter to date (which is now the completed 2008-Q1 period) shows still strong results for Italian output. But the monthly numbers reveal a different trend. The quarter’s lift stems totally from the spurt in output in January. Since then output trends are on the decline in all sectors with the exception of transportation. Consumer goods output spurted by 3.6% in January, then fell by 2.6% in February and fell further, by 0.7% in March. Capital goods output has declined in March. Intermediate goods output is off for the last two months in a row – just about negating the rise in January.
The graph shows that output trends in France and Germany are topping while Italy is seeing the sharpest deceleration among the EMU big-three economies.
| Italy IP Excluding Construction | |||||||
|---|---|---|---|---|---|---|---|
| SAAR except m/m | Mar-08 | Feb-08 | Jan-08 | 3-mo | 6-mo | 12-mo | Quarter-to-date |
| IP-MFG | 0.0% | -0.2% | 1.9% | 7.0% | -1.4% | -1.9% | 5.3% |
| Consumer Goods | -0.7% | -2.6% | 3.6% | 0.9% | -2.1% | -4.3% | 3.2% |
| Capital Goods | -0.3% | 0.3% | 6.3% | 27.9% | -0.8% | -1.2% | 16.1% |
| Intermediary Goods | -0.5% | -0.7% | 1.3% | 0.0% | -4.1% | -3.1% | 1.0% |
| Memo | |||||||
| Transportation | 2.7% | 1.7% | 3.0% | 33.8% | 0.7% | 5.7% | 6.2% |
by Louise Curley May 12, 2008
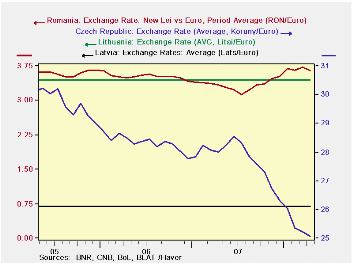
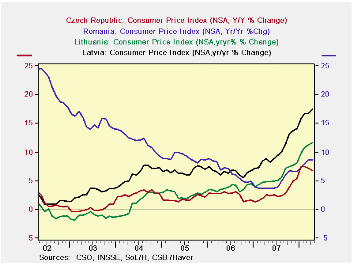
Four Eastern European countries--the Czech Republic, Romania, Latvia and Lithuania--reported inflation rates for April today. Inflation rates are shown in the first chart. In April inflation ranged from a low of 6.8% for the Czech Republic to a high of 17.4% in Latvia. Lithuania, the other Baltic state reporting today, also reported a high rate of inflation, 11.7%, while inflation in Romania came in at 8.6%. Inflation in these countries began to take off in early 2007, as in so many other countries, with the rises in the prices of food and oil.
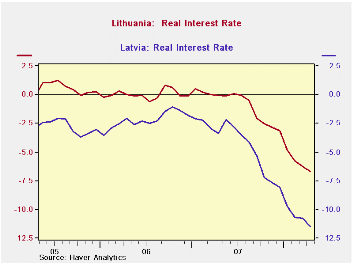
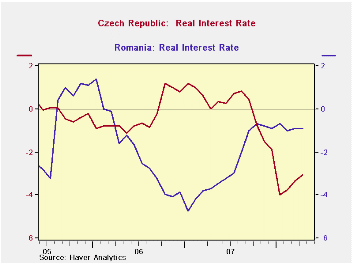
Latvia and Lithuania have kept their policy interest rate unchanged while the Czech Republic and Romania have increased them. However, all four countries have negative interest rates as shown in the second and third charts.
Only the Czech Republic has experienced an appreciation of its currency relative to the Euro that has been a major factor in keeping its inflation relatively subdued. Latvia and Lithuania have tied their currencies to the Euro and Romania has recently seen its currency depreciate. The Euro exchange rates of the four countries are shown in the fourth chart.
| INFLATION (%) | Apr 08 | Mar 08 | Feb 08 | Jan 08 | Apr 07 | 2007 | 2006 | 2005 |
|---|---|---|---|---|---|---|---|---|
| Czech Republic | 6.8 | 7.1 | 7.5 | 7.5 | 2.5 | 2.8 | 2.5 | 1.9 |
| Romania | 8.6 | 8.6 | 8.0 | 7.3 | 3.8 | 4.8 | 6.6 | 9.0 |
| Latvia | 17.5 | 16.8 | 16.7 | 15.8 | 8.9 | 10.1 | 6.5 | 6.5 |
| Lithuania | 11.7 | 11.3 | 10.8 | 9.9 | 4.8 | 5.7 | 3.7 | 2.7 |
| POLICY INTEREST RATE | May 08 | |||||||
| Czech Republic | 3.75 | -- | -- | -- | -- | -- | -- | -- |
| Romania | 9.75 | -- | -- | -- | -- | -- | -- | -- |
| Latvia | 6.0 | -- | -- | -- | -- | -- | -- | -- |
| Lithuania | 5.0 | -- | -- | -- | -- | -- | -- | -- |

Tom Moeller
AuthorMore in Author Profile »Prior to joining Haver Analytics in 2000, Mr. Moeller worked as the Economist at Chancellor Capital Management from 1985 to 1999. There, he developed comprehensive economic forecasts and interpreted economic data for equity and fixed income portfolio managers. Also at Chancellor, Mr. Moeller worked as an equity analyst and was responsible for researching and rating companies in the economically sensitive automobile and housing industries for investment in Chancellor’s equity portfolio. Prior to joining Chancellor, Mr. Moeller was an Economist at Citibank from 1979 to 1984. He also analyzed pricing behavior in the metals industry for the Council on Wage and Price Stability in Washington, D.C. In 1999, Mr. Moeller received the award for most accurate forecast from the Forecasters' Club of New York. From 1990 to 1992 he was President of the New York Association for Business Economists. Mr. Moeller earned an M.B.A. in Finance from Fordham University, where he graduated in 1987. He holds a Bachelor of Arts in Economics from George Washington University.
More Economy in Brief


