 Global| Aug 29 2003
U.S. After Tax Income Spiked, Personal Spending Surged
by:Tom Moeller
|in:Economy in Brief
Summary
Tax cuts and rebate checks lowered personal tax payments by 9.3% (-10.3% y/y) last month. That decline raised disposable personal income by 1.5% m/m and by 5.2% y/y. The surge in disposable income fueled an expected 0.8% gain in [...]
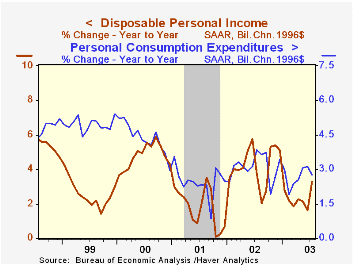
Tax cuts and rebate checks lowered personal tax payments by 9.3% (-10.3% y/y) last month. That decline raised disposable personal income by 1.5% m/m and by 5.2% y/y.
The surge in disposable income fueled an expected 0.8% gain in personal consumption expenditures. Spending on durable goods jumped 2.1% as sales of light vehicles surged 5.5% to 17.34M units, the highest selling rate since December. Lower prices added to the incentive to buy. The durables' price deflator fell 0.2% (-3.1% y/y). Constant dollar durables spending rose 2.4% (6.1% y/y).
Personal consumption of services rose 0.5% (4.6% y/y) while services prices rose a moderate 0.3% (3.0% y/y), the same as in the prior two months. Nondurables spending rose 0.8% (5.5% y/y) following a like gain in June.
In contrast to the strong gains in after tax income, wages and salaries were down slightly (2.5% y/y) after two months of 0.3% gain. That weakness was behind only a slight 0.2% rise in personal income, the weakest gain since April and slightly lower than Consensus expectations for a 0.3% uptick. Proprietors' income rose 1.1% (9.1% y/y) but personal interest income was unchanged (0.1% y/y).
The saving rate jumped to 3.8% on the strength in disposable income. That was the highest savings rate since February.
Less food & energy the chain price index for PCE rose 0.2% (1.4% y/y), a slight uptick from the 0.0-0.1% gains of the prior nine months.
| Disposition of Personal Income | July | June | Y/Y | 2002 | 2001 | 2000 |
|---|---|---|---|---|---|---|
| Personal Income | 0.2% | 0.4% | 3.3% | 2.7% | 3.3% | 8.0% |
| Personal Consumption | 0.8% | 0.6% | 4.6% | 4.5% | 4.5% | 7.0% |
| Savings Rate | 3.8% | 3.1% | 3.2% | 3.7% | 2.3% | 2.8% |
| PCE Price Deflator | 0.2% | 0.2% | 1.8% | 1.4% | 2.0% | 2.5% |
by Tom Moeller August 29, 2003
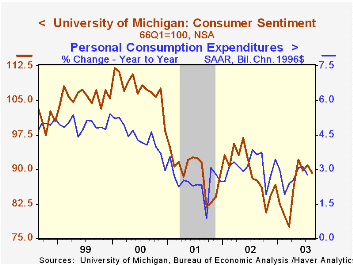
The University of Michigan’s consumer sentiment index fell somewhat more than expected for the full month of August. The decline to 89.3 implied that sentiment deteriorated throughout the month and was versus Consensus expectations for a reading of 90.5.
The mid-month reading of sentiment reported earlier this month fell to 90.2 from 90.9 in July.
The Index of Consumer Expectations added to a slight decline reported mid-month and fell 1.4% (2.4% y/y). It was the third consecutive monthly drop.
The read of Current Economic Conditions fell 2.4% from July but was up 1.2% y/y. That decline was slightly larger than the 1.6% drop reported mid-month.
Over the last ten years there has been a 70% correlation between the level of consumer sentiment and the y/y change in real PCE. The correlation over the last five years has been 82%.
The University of Michigan survey is not seasonally adjusted.It is based on telephone interviews with 250 households nationwide on personal finances and business and buying conditions. The survey is expanded to a total of 500 interviews at month end.
| University of Michigan | August | July | June | 2002 | 2001 | 2000 |
|---|---|---|---|---|---|---|
| Consumer Sentiment | 89.3 | 90.9 | 89.7 | 89.6 | 89.2 | 107.6 |
by Tom Moeller August 29, 2003

The Chicago Purchasing Managers “Business Barometer” rose another 3.0 points in August to 58.9. That was the highest reading since May of last year and beat the Consensus estimate of 56.0.
Higher production led the gain in the total barometer, up to 61.6 versus a low of 49.1 in March. Employment also rose strongly to 51.2, the highest level since January 2000. New orders fell slightly to a still high 60.5.
During the last twenty years there has been a 59% correlation between the level of the Chicago PMI and quarterly growth in real GDP.
The index of prices paid moved up to 52.4, the first month over 50 since May.
View the latest release from the Chicago Purchasing Managers here.
| Chicago Purchasing Managers Index, SA | Aug | July | Y/Y | 2002 | 2001 | 2000 |
|---|---|---|---|---|---|---|
| Business Barometer | 58.9 | 55.9 | 54.0 | 52.7 | 41.4 | 51.8 |
| New Orders | 60.5 | 61.7 | 54.0 | 56.3 | 42.3 | 53.1 |
| Prices Paid | 52.4 | 47.9 | 65.1 | 56.9 | 50.4 | 65.6 |
by Tom Moeller August 29, 2003
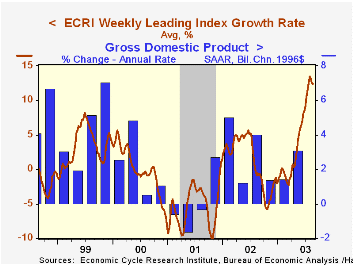
The Weekly Leading Index of the US economy published by the Economic Cycle Research Institute (ECRI) ticked up the week of August 22nd. That was enough to keep strong series' growth rate, but since second week of July the index has been roughly unchanged.
A report titled "How Did Leading Indicator Forecasts Perform During the 2001 Recession?" by James H. Stock & Mark W. Watson from the Federal Reserve Bank of Richmond can be found here .
The six-month growth rate of the weekly leading index stood at 12.4%. That's about where it's been for the last six weeks.
Mortgage loan applications slipped due to anxiety over increasing long-term interest rates and that offset gains in the stock market and higher oil prices.
During the last five years there has been a 59% correlation between growth in the leading index and next quarter's growth in real GDP.
Construction of the ECRI Leading Index differs from the Index of Leading Economic Indicators published by the Conference Board. Nevertheless there has been a 77% correlation between the y/y percent change in the two series over the last 20 years.
The components of the ECRI weekly leading index are money supply plus stock & bond mutual funds, the JOC-ECRI industrial materials price index, mortgage applications, bond quality spreads, stock prices, bond yields, and initial jobless insurance claims.
The median lead of the ECRI index at business cycle peaks has been 10.5 months and at cycle troughs 3.0 months. The sideways movement of the leading index in 2002 may or may not signal something about the economy's growth rate.
For more on ECRI and the Weekly Leading Index go to this link.
| ECRI Leading Index | 8/22/03 | 8/15/03 | Growth Rate | 2002 | 2001 | 2000 |
|---|---|---|---|---|---|---|
| Weekly | 127.8 | 127.6 | 12.4% | 1.2% | -5.3% | -0.1% |
| Aug | July | |||||
| Monthly | 127.8 | 127.2 | 13.0% |

Tom Moeller
AuthorMore in Author Profile »Prior to joining Haver Analytics in 2000, Mr. Moeller worked as the Economist at Chancellor Capital Management from 1985 to 1999. There, he developed comprehensive economic forecasts and interpreted economic data for equity and fixed income portfolio managers. Also at Chancellor, Mr. Moeller worked as an equity analyst and was responsible for researching and rating companies in the economically sensitive automobile and housing industries for investment in Chancellor’s equity portfolio. Prior to joining Chancellor, Mr. Moeller was an Economist at Citibank from 1979 to 1984. He also analyzed pricing behavior in the metals industry for the Council on Wage and Price Stability in Washington, D.C. In 1999, Mr. Moeller received the award for most accurate forecast from the Forecasters' Club of New York. From 1990 to 1992 he was President of the New York Association for Business Economists. Mr. Moeller earned an M.B.A. in Finance from Fordham University, where he graduated in 1987. He holds a Bachelor of Arts in Economics from George Washington University.
More Economy in Brief


